Gold at $4,502: Is This Dip a Buy? BofA Sees $6,000
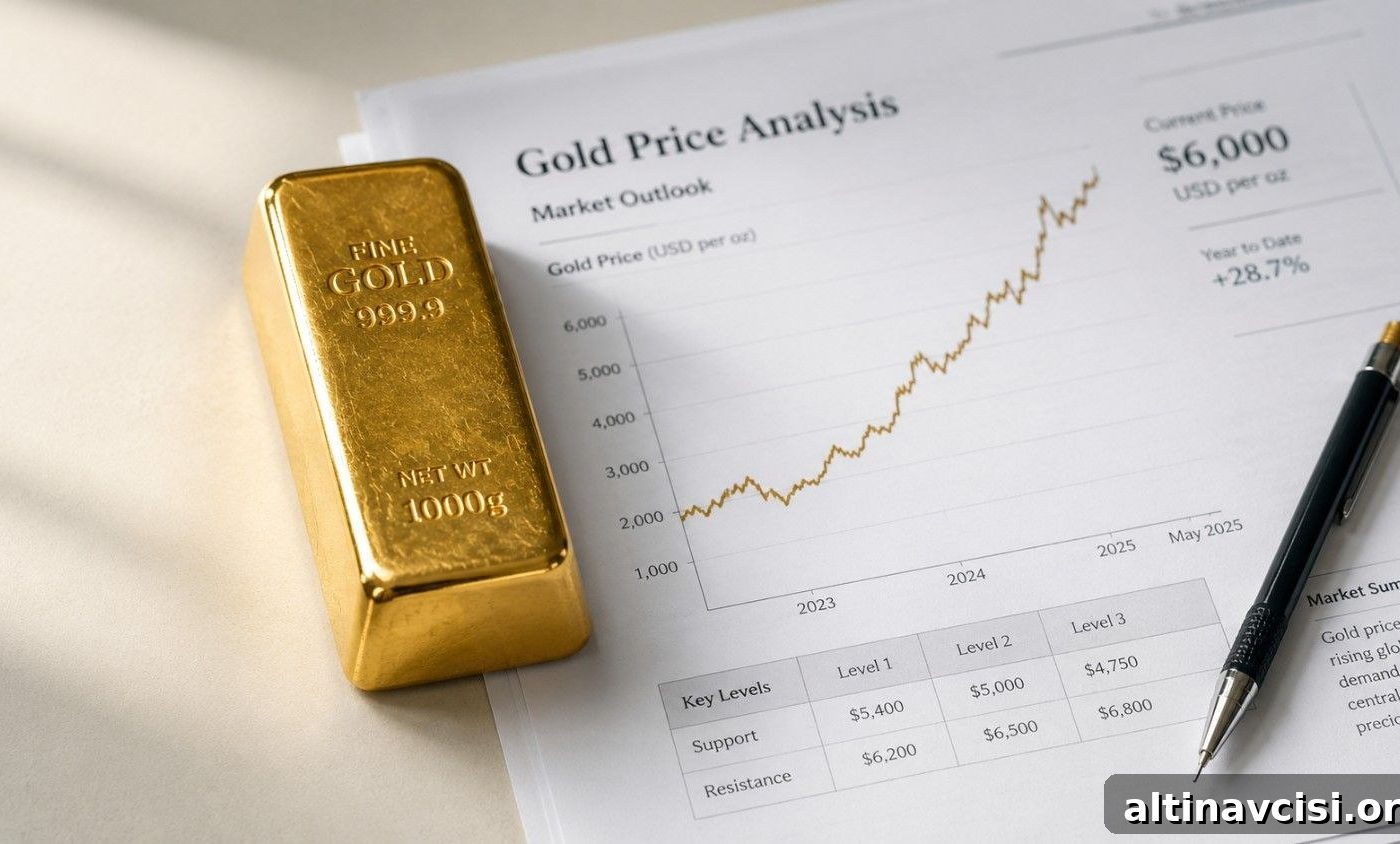
In today’s update: Gold slipped to about $4,502 as Treasury yields rose, but major institutions remain bullish — Bank of America targets $6,000, Goldman Sachs calls the pullback an accumulation zone, and the underlying structural case for higher prices remains intact.
The gold price dropped to roughly $4,502 per ounce Wednesday morning after a sharp move higher in Treasury yields and a firmer U.S. dollar pressured the metal. Bank of America continues to forecast a $6,000 target, and Goldman Sachs describes the current dip as an institutional accumulation zone. Outside geopolitics, Hong Kong is preparing to launch a new gold clearing platform in July aimed at expanding physical settlement options beyond existing London and New York price networks. These developments interact: short-term price moves are driven by yields and dollar strength, while the longer-term structural forces that support gold remain unchanged.
Why Did Gold Fall Today?
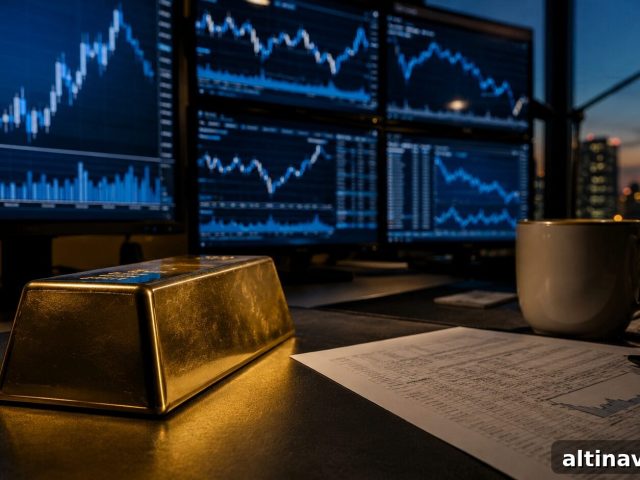
At 8:39 AM ET, gold traded near $4,502 per ounce within a daily range of about $4,454 to $4,509. The dominant short-term driver was a rapid rise in the 10-year Treasury yield, which makes interest-bearing assets more attractive relative to non-yielding bullion. When yields climb, money often rotates out of gold and into fixed-income instruments. A firmer U.S. dollar amplified the effect by making dollar-priced gold more expensive for overseas buyers, reducing global demand. Silver, by contrast, traded near $75.64 per ounce and showed short-term strength, rising roughly 2.7% on the day.
This yield-driven dynamic has preceded many major gold rallies in recent years. When real yields compress—whether through Fed rate cuts, rising inflation, or both—the trend reverses quickly and gold can climb sharply. Today’s selling activity should be viewed in that context: short-term noise that can set the stage for renewed buying when yields and real rates shift.

The Edge Every Investor Needs
Smarter precious metals investing starts here. The Nuggets Newsletter delivers concise market analysis, Fed updates, global trends, and educational materials to help you make informed decisions.
Why Is Bank of America Calling $6,000 Gold?
Bank of America’s $6,000 gold target is one of the most bullish forecasts from a major institution. Their thesis rests on three core forces: persistent U.S. fiscal deficits that increase currency and inflation risk, unusually strong central bank buying that expands official demand, and a gradual erosion of confidence in Treasuries as a dependable store of value. At current prices, a $6,000 target implies roughly a one-third upside over the next year if those structural forces assert themselves.
BofA frames recent dips as tactical fluctuations rather than a change in the long-term trend. Their analysis asks not whether gold will rise, but what would have to change materially for the structural bull case to fail. Until those large macro dynamics shift, the bank expects the upward structural trend to persist despite short-term volatility.
Is the Gold Dip a Buying Opportunity?
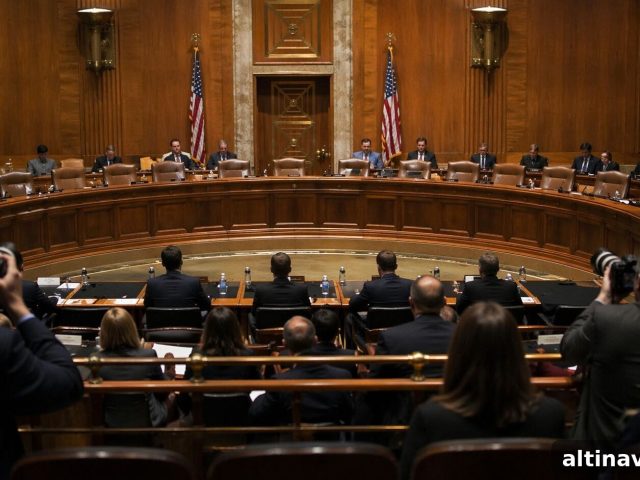
Goldman Sachs views the recent decline as an accumulation zone—levels where institutional buyers tend to step in rather than exit. Their recommendation is essentially to buy on weakness rather than sell. Key demand drivers behind this stance include central bank purchases at multi-decade highs, de-dollarization flows from BRICS and other emerging-market economies, and the structural constraint on how high the Federal Reserve can raise rates without triggering fiscal stress. Historically, every yield spike that briefly pressured gold over the past two years saw institutional demand absorb the selling and push prices higher again. Today’s dip is another test of that institutional floor.
What Does the US-Iran Standoff Mean for Gold?
Ceasefire and nuclear talks between the U.S. and Iran have stalled this week. Geopolitical risk is a key component of gold’s safe-haven appeal, so any breakdown in talks tends to support prices. Earlier optimism around a possible agreement briefly reduced gold’s risk premium, but the renewed impasse has restored some of that safe-haven demand.
Beyond headline risk, disruptions to Iran’s oil exports and shipping through the Strait of Hormuz feed into energy markets and inflation expectations—factors that influence gold’s macro outlook. A negotiated settlement would likely shrink the risk premium and weigh on gold near-term; conversely, escalating tensions would add upward pressure. Markets currently show no strong consensus, so the Iran standoff remains an important but uncertain input to gold’s price direction.
Is Asia Building a Rival Gold Pricing System?
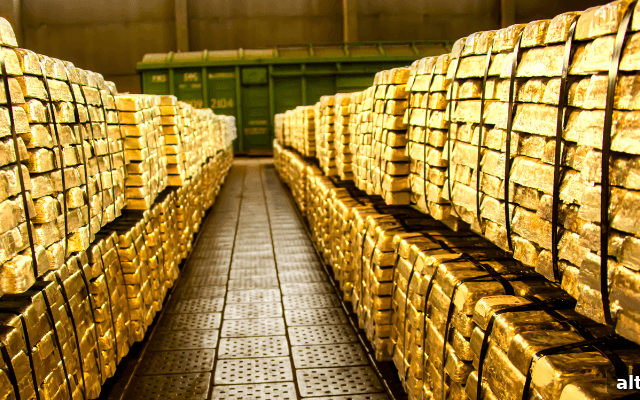
Hong Kong plans to launch the Hong Kong Precious Metals Central Clearing Company in July 2026, a new clearing and settlement platform intended to support physical gold trading and alternative settlement arrangements. Built in cooperation with the Shanghai Gold Exchange, the platform will enable yuan-denominated settlement alongside U.S. dollar pricing. This development is part of a broader push in Asia to deepen physical markets and offer alternatives to long-standing London and New York pricing centers.
Recent diplomatic alignment between China and Russia and increased trade in non-dollar currencies are consistent with a long-term trend toward diversified settlement systems. These changes strengthen the structural demand base for physical gold and broaden the market’s settlement depth. While this shift won’t necessarily move prices this week, it adds to the multi-year bull case by expanding buyers and settlement infrastructure outside traditional Western networks.
In short: gold fell today largely because yields and the dollar moved, but major structural drivers remain intact. Bank of America’s $6,000 forecast and Goldman Sachs’ accumulation-zone view can coexist with short-term weakness because the forces pushing gold higher—fiscal deficits, central bank demand, and shifting confidence in dollar assets—are structural, not tactical. The practical question for investors is not whether a single session’s move invalidates the trend, but whether the fundamentals that supported the move to $4,500 have broken. This week, they have not.
Gold and silver prices quoted as of 8:39 AM ET, May 20, 2026. Analysis is provided for informational purposes only and does not constitute investment advice.
SOURCES
1. nFusion Solutions — Gold & Silver Spot Price API
2. Federal Reserve — H.15 Selected Interest Rates; FRED, St. Louis Fed — 10-Year Treasury Rate
3. TheStreet — Bank of America gold outlook coverage
4. The Wealth Advisor; Yahoo Finance — Goldman Sachs gold outlook reporting
5. World Gold Council — Gold Demand Trends Q1 2026; Central Bank Demand reports
6. Al Jazeera; Times of Israel — coverage of US-Iran talks
7. U.S. Energy Information Administration; Bloomberg — reporting on Strait of Hormuz flows and oil transit
8. Bloomberg; Caixin Global — Hong Kong gold-clearing system and storage expansion reporting
9. NPR; RFE/RL — reporting on recent China-Russia summit and energy discussions
Disclaimer: This article is for informational purposes only and does not constitute financial or investment advice. Consult a qualified financial advisor before making investment decisions.
You May Also Like:
- Gold Didn’t Fall on Iran Peace News. That’s the Point.
- Trump Called Off the Strike. Gold’s Real Risk Is Still $39 Trillion.
- The Gold Market Is Mostly Paper. Dubai Disagrees.
- The Institutions Are Buying. Yields Are Rising. What Does That Tell You?
- Gold Up 40% in a Year. The Moody’s Downgrade Explains Why.
- No Deal, No Premium: Why Silver Fell 7% at the Trump-Xi Summit
- Gold Fell. China Bought Its Most in 17 Months. Here’s Why.
- Why Silver Falls Harder Than Gold — And What It Means
Popular Topics
Picked from the archive
-
01
 Topics
Moody’s Economist: US Economy Nears Recession After Jobs Plunge
-
02
Topics
Insurance vs Upside: How Gold and Silver Balance Your Portfolio
-
03
Topics
World Gold Council: Gold Eyes $3,351 as Triangle Break Nears
-
04
Topics
Could the U.S. Government Seize Your Gold Again?
-
05
Topics
How Kevin Warsh as Fed Chair Could Affect Gold Prices
-
06
Topics
Gold at $4,481 as Rate-Hike Risk Rises: NFP Decision Map
-
07
Topics
Should You Invest in Gold in 2026: Bars, Coins, IRAs or ETFs?
-
08
Topics
Tariffs Drive Gold Premium Over $100 Between New York and London