Why Gold ETF Holdings Rose in October as Assets Dropped 6%
Last verified November 2026.
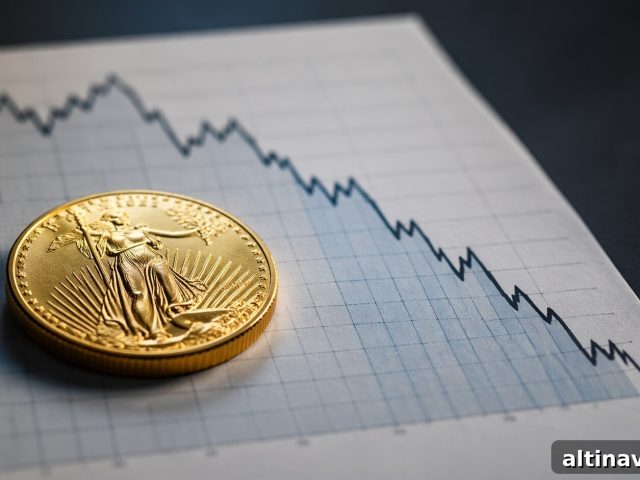
Gold-backed exchange-traded funds (ETFs) reached a record holding by weight at the end of October 2026, with 4,275 tonnes of gold under management, according to the World Gold Council’s November 5, 2026 report. Despite this new high in physical holdings, the funds’ combined dollar value fell about 6% to roughly $542 billion. That divergence reflects a simple accounting fact: more metal does not automatically mean a higher dollar valuation when the price of gold declines.
Key Takeaways
- Tracked gold ETF holdings rose by 19 tonnes in October to a month-end record of 4,275 tonnes, while assets under management (AUM) fell about 6% to $542 billion.
- Estimated net inflows for the month (~$2.7 billion) could not offset the drop in gold’s market price, so the funds held more metal but had a smaller dollar value.
- Regional flows were mixed: Europe and Asia saw inflows, North America experienced outflows, and smaller gains occurred elsewhere; fund totals exclude direct purchases of physical bars by households and do not reveal individual motives.
Why did gold ETF holdings rise while their dollar value fell?
Understanding the difference requires separating three measures: tonnes (physical weight), net flows (money moving in or out), and assets under management (AUM), which expresses holdings in dollar terms. In October the funds added 19 tonnes of gold, so inventory by weight increased. At the same time, the market price of gold fell enough that when the councils and funds converted metal to dollars, the total AUM declined.
Put differently, the new inflows bought more ounces, but each ounce was priced lower at month-end. The World Gold Council highlights this mechanism: its holdings-by-weight figure and its AUM figure are both accurate, but they answer different questions—one about inventory, the other about value at a point in time.
The council’s data track ETFs and comparable open-ended funds that are largely physically backed. These figures do not include every type of gold ownership; direct retail purchases of coins and bars, private vault holdings, and some institutional arrangements fall outside the ETF universe reported here.
Did gold funds everywhere attract new money?
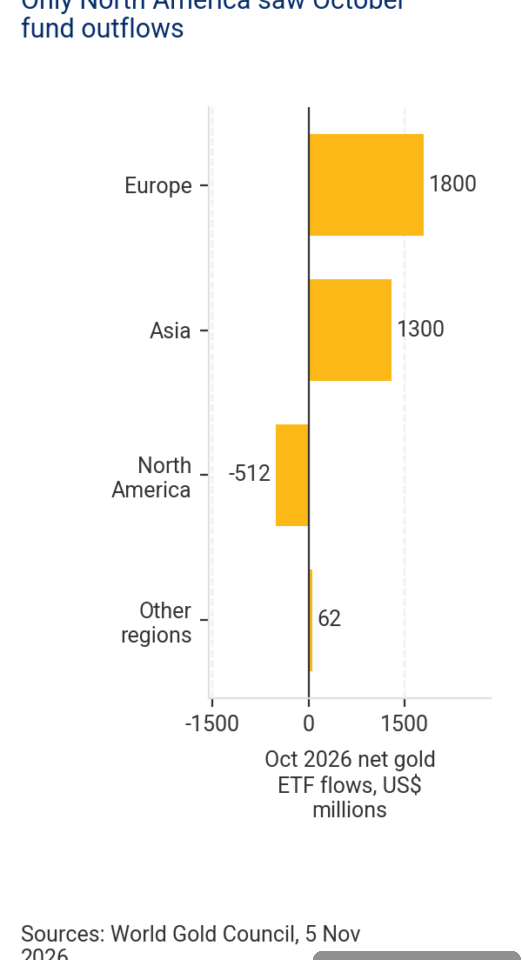
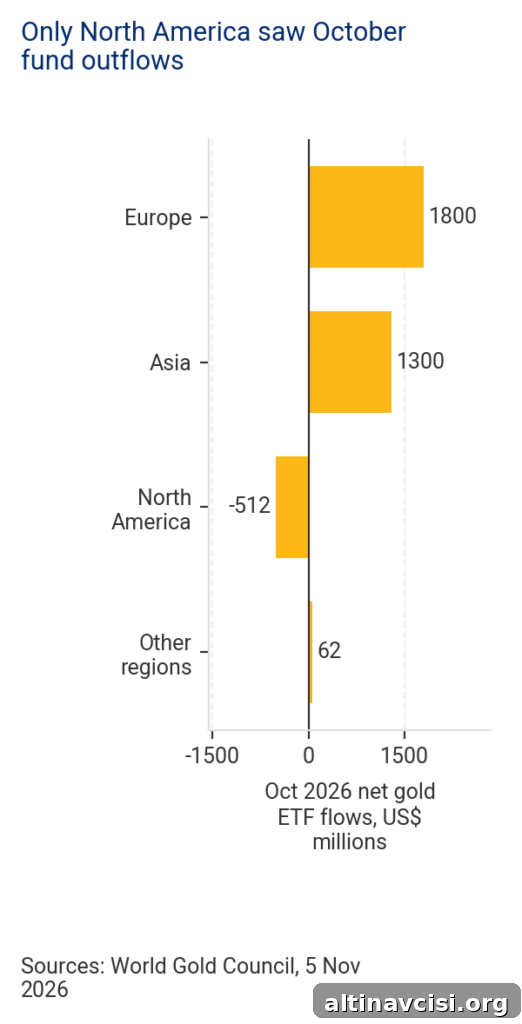
Not uniformly. The World Gold Council’s October regional breakdown shows estimated inflows of roughly $1.8 billion into European funds and about $1.3 billion into Asian funds, offset by an estimated $512 million of outflows from North American funds and a small $62 million gain in other regions. Because the council reports and rounds regional totals independently, regional numbers may not sum precisely to the rounded global inflow figure of $2.7 billion.
These regional patterns demonstrate that aggregate inflows do not necessarily represent unanimous investor sentiment. Money moved into funds in some markets while it left others. The fund flow data also do not explain why individual investors bought or sold—only that net activity across many investors produced those regional totals.
Why do ounces held and dollar value tell different stories?
Ownership form matters. Holding an ETF share gives exposure to a basket of bullion via an exchange, while holding a physical bar provides direct control of the metal. Each form carries different costs and risks—storage and insurance for physical bullion, trading spreads and management fees for ETFs—and both are exposed to the same market price swings.
A physical owner keeps the same number of ounces even when the dollar value changes; similarly, an ETF can hold additional ounces while its market valuation falls. October’s figures highlight this separation between nominal quantity and market valuation: more ounces in a fund do not guarantee a larger dollar balance if the price per ounce drops.
Stay On Top of Gold & Silver Prices
Sign up for timely market alerts and concise insights about gold and silver trends.
SOURCES
World Gold Council — Gold ETFs: Holdings and Flows, October 2026; industry outlook and reporting by market commentators covering gold and silver trends in late 2026.
Disclaimer: This article is for informational purposes only and does not constitute investment advice. Past performance is not indicative of future results. Consult a qualified financial advisor before making investment decisions.
You May Also Like:
- Bank of England Rate Hike to 4%: Two Forces for Gold Owners
- Gold Climbs as Treasury Yields Slide
- Precious Metals React to Midterm Election Results
- Gold Nearing Key Resistance Levels
- Central Bank Gold Buying and Bar & Coin Demand Trends
- Why Gold and Silver Are Rebounding
- October 2026 Selloff: What Changed for Gold and Silver
- Silver Price Movements Compared with Gold
- China’s Gold Imports and Regional Demand Patterns
Popular Topics
Picked from the archive
-
01
 Topics
Why Investors Choose the Vienna Philharmonic Gold Coin
-
02
Topics
Stablecoin Issuer Outspent Central Banks on Gold Last Year
-
03
Topics
Why Gold Prices Are Falling Amid the Oil War
-
04
Topics
How to Buy Gold in 2026: Step-by-Step Guide for Beginners
-
05
Topics
Silver Appears Weak, Silver-to-Gold Ratio Signals Accumulation
-
06
Topics
Why Gold Prices Are Falling: What Most Investors Get Wrong
-
07
Topics
Should You Still Hold Gold in Your Portfolio?
-
08
Topics
Gold Bars vs Jewelry: Why Investors Choose Bullion