Strong Jobs Report Pushes Gold Lower as Silver Holds Steady
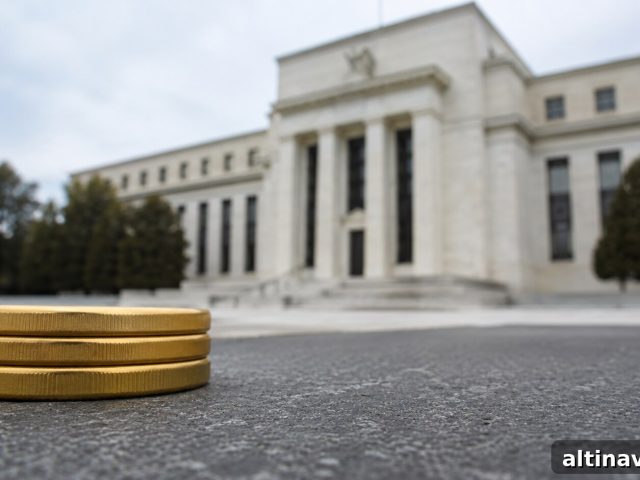
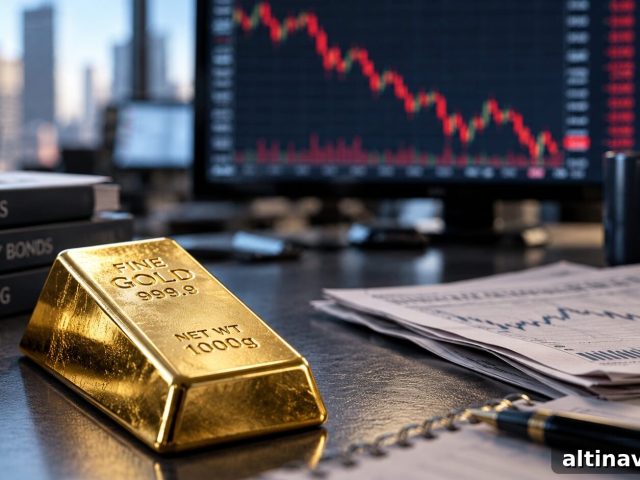
Gold suffered its biggest one-day drop in more than a week after this morning’s October jobs report surprised the market. The Bureau of Labor Statistics reported nonfarm payrolls increased by 165,000 in October, well above the 65,000 economists had expected. The unemployment rate edged down to 4.1% from 4.2%, and September’s initially weak print of 29,000 jobs was revised up to 60,000. Within an hour of the release, spot gold fell to roughly $4,048 per ounce, off about 1% from Thursday’s close, while silver remained near $52. That divergence between gold and silver is the key market story today.
Why Did Gold Fall After a Strong Jobs Report?
A stronger-than-expected labor market alters expectations about Federal Reserve policy, and expectations drive markets. Before the report, traders had priced in roughly a three-in-four chance of another Fed rate increase at the December meeting; the stronger employment data pushed those odds higher. Short-term and long-term Treasury yields rose—10-year yields ticked up to around 4.88%, and 2-year yields climbed to near 4.52%—and the U.S. Dollar Index strengthened to about 102.18. Higher yields raise the opportunity cost of holding non-yielding assets like gold, and a firmer dollar makes dollar-priced bullion more expensive for international buyers. Those two forces combined to send gold lower almost immediately after the jobs figures hit the tape.
The Edge Every Investor Needs
Smarter precious metals investing starts here. The Nuggets Newsletter delivers market insight, Fed updates, and timely analysis.
Why Didn’t Silver Fall the Same Way?
Silver reacted differently because industrial demand plays a much larger role in its market than it does for gold. Roughly three in five ounces of silver are consumed by industry rather than held for investment or jewelry use. A strong jobs report signals ongoing activity in factories and production lines, supporting demand for silver from industrial buyers. That demand partially offset the same rate-and-dollar pressures that pushed gold lower. As a result, the gold-to-silver ratio—how many ounces of silver it takes to buy one ounce of gold—fell from about 79 at Thursday’s close to roughly 77.9 today, indicating silver gained ground relative to gold even while gold itself slipped.
What Does This Mean for the Fed’s December Decision?
A single employment report will not determine the Fed’s December decision on its own, but it does shift the balance of risks the Fed considers. Average hourly earnings rose about 3.1% year-over-year, a touch stronger than analysts expected, which keeps inflation concerns on the table alongside labor-market strength. Market odds for a December rate increase can swing quickly with fresh data: in recent days, falling Treasury yields had reduced the probability of another hike, and this morning’s stronger jobs numbers reversed some of that decline. The next meaningful data point for monetary policy is the upcoming Consumer Price Index report; until that arrives, markets and precious metals will likely react to each new inflation and jobs release that informs the Fed’s reaction function.
What Should Long-Term Owners Take From Today’s Move?
A one-day, roughly 1% move in gold is not a reason to overhaul a long-term asset allocation. The fundamental drivers behind today’s swing—real yields and the dollar—have influenced precious metals through many Fed cycles. Short-term volatility tied to macro data is normal, and it does not negate the reasons investors hold physical bullion or bullion-backed allocations for diversification, inflation protection, or portfolio insurance. Silver’s steadier performance highlights its additional industrial demand, underscoring why gold and silver do not always move in parallel. For many investors, maintaining exposure to both metals rather than reacting to a single day’s headline remains a more resilient approach.
Stay On Top of Gold & Silver Prices
Get timely market alerts delivered to your inbox.
Live price widget removed for this version.
SOURCES
1. Reuters — “Traders Raise Bets of Fed Rate Hike After Jobs Report”
2. CNBC — “U.S. Economy Added 165,000 Jobs in October, Way More Than Expected; Unemployment Rate at 4.1%”
3. CNBC Investing Club — “Our Top 10 Things to Watch in the Stock Market Friday”
4. The Silver Institute (via BusinessStats) — “Silver Demand by End Use 2026”
5. Federal Reserve — Official 2026 FOMC Meeting Calendar
6. GoldSilver — Live Gold and Silver Price Charts
Disclaimer: This article is for informational purposes only and does not constitute investment advice. Past performance is not indicative of future results. Consult a qualified financial professional before making investment decisions.
You May Also Like:
- October Gold ETF Holdings Rose as Fund Assets Fell 6%
- Bank of England Rate Hike to 4%: Two Forces for Gold Owners
- Gold Climbs to $4,124 as Treasury Yields Slide
- Gold Silver Price Today: Midterm Election Results Spark Rally
- Gold, Silver Price Today: Gold Nears $3,970 Resistance
- Q3 Central Bank Gold Buying +42%, Bar-and-Coin Demand -19%
- Gold, Silver Prices Today: Why Are They Rebounding?
- Gold and Silver’s October Selloff: What Changed?
- Silver Price Below $50: Why It’s Falling Faster Than Gold
Popular Topics
Picked from the archive
-
01
 Topics
Gold Price Per Ounce: What It Reveals About the Market
-
02
Topics
Why $4,454 Gold Means the Fed Is Trapped
-
03
Topics
China Moves Gold Reserves After 20-Month Buying Spree
-
04
Topics
Gold vs Savings Account: Which Investment Beats Inflation Now?
-
05
Topics
Investors Flock to Treasuries as AI Stocks Slide
-
06
Topics
Gold Surges to $4,480 as Physical Demand Hits 50-Year High
-
07
Topics
What Moved Gold and Silver Today: Hormuz, ISM, Hecla, Barrick
-
08
Topics
Gold Price Loses All Post-Election Gains