Silver Price Falls Below $50: Why It’s Dropping Faster Than Gold
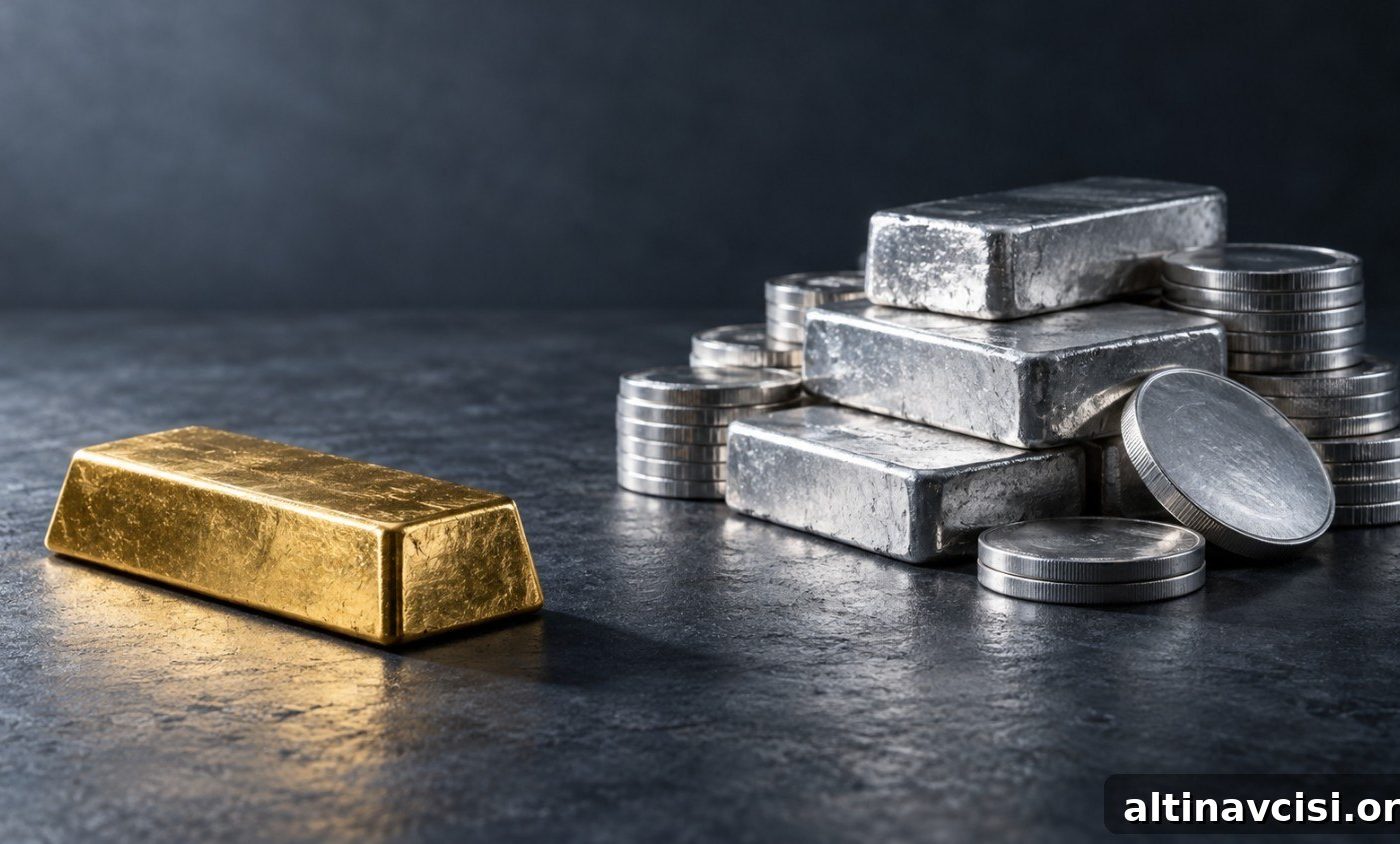
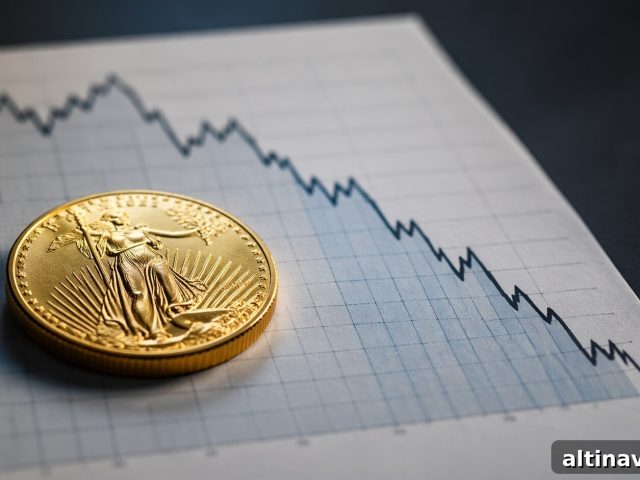
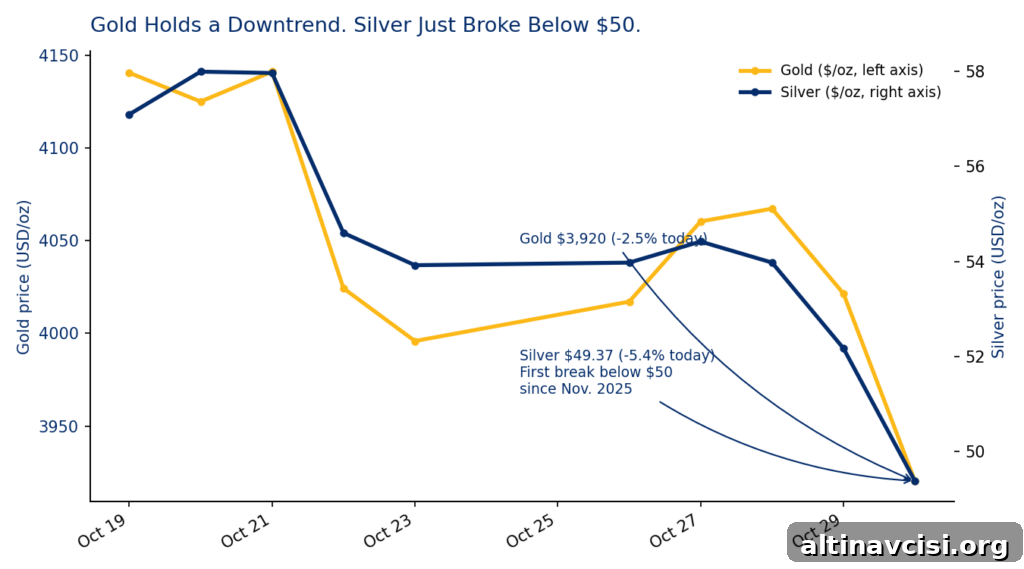
Gold fell to its weakest level since June on Friday, while silver dropped below $50 an ounce for the first time since November 2025. By 10:00 a.m. ET, spot gold was trading at $3,920.37, down about 2.5% on the day, and spot silver was near $49.37, down roughly 5.4%. Both metals extended losses through the session as traders reacted to shifting expectations about U.S. monetary policy.
What Happened to Gold and Silver Prices Today?
Both metals had strengthened earlier in the week, but a sharp reversal on Thursday and Friday pushed gold to a four-month low and sent silver below a threshold it had not breached since last November. Gold finished the month down roughly 4.7% for October and is on track for a second consecutive monthly decline. Silver’s decline has been steeper: much of the rally that lifted it above $57 earlier in the month has been given back as traders reassess the outlook.
Stay On Top of Gold & Silver Prices
Sign up for timely market alerts and concise precious‑metals analysis delivered to your inbox.
Why Are Gold and Silver Falling Right Now?
The selloff reflects an updated policy outlook from the Federal Reserve rather than a single surprise. The Fed left its benchmark rate in its target range at 3.75%–4.00% this week, but dissent among policymakers and hawkish commentary prompted markets to price in additional rate risk. Stronger U.S. economic data—most notably an advance estimate for third‑quarter GDP of 3.4% annualized and core PCE inflation holding at 2.5% year‑over‑year—reinforced the view that rates may stay higher for longer and that another rate increase is possible later in the year.
Higher expected policy rates raise the opportunity cost of owning non‑yielding assets such as gold and silver. At the same time, real yields—measured by inflation‑protected Treasury yields—moved higher, giving fixed‑income instruments a more attractive return relative to precious metals. That combination encouraged repositioning out of gold and silver and into interest‑bearing assets, producing a relatively straight‑line repricing after the GDP release.
Why Is Silver Falling Faster Than Gold?
Silver’s sharper decline is explainable by its dual role: it’s both a monetary metal and an industrial commodity. Gold trades primarily as a monetary store and central‑bank reserve asset, while silver carries significant industrial demand from sectors such as solar energy, electronics and electric vehicles. According to industry surveys, industrial use represents a large share of annual silver demand.
When growth data strengthens and traders sell precious metals because of rising rate expectations, silver must be repriced for both a weaker monetary case and a revised industrial outlook. That double exposure typically causes silver to amplify gold’s moves in either direction. Analysts monitoring the physical silver market have noted additional relative weakness in silver even while the longer‑term bull case for precious metals remains intact.
What Does the Widening Gold-Silver Ratio Tell Us?
The gold‑silver ratio—how many ounces of silver buy one ounce of gold—provides a clear way to see the divergence. Two weeks earlier the ratio was near 72.5; by Friday it had jumped above 79. A rising ratio indicates silver is underperforming gold. Historically, sharp increases in the ratio have preceded periods when silver recovers relative to gold once rate pressures ease or the growth/inflation mix changes. However, historical precedents say little about precise timing, and markets can remain stretched for some time.
Where Does This Leave Gold and Silver Investors?
Friday’s drop does not erase the multi‑year rationale for holding monetary metals. Central banks continued to buy gold through 2026, and structural pressures on fiat currencies—rising debt burdens and persistent deficits—remain a long‑term driver for precious‑metal demand. Gold and silver function as a hedge against monetary debasement over time, not just as short‑term bets around specific Fed meetings.
What has changed is the near‑term path. Key technical levels that traders watch have been tested; for gold, the $3,975 and $3,946 supports were broken and $3,900 is now cited as the next major support area. For silver, intraday lows dipped below $50 with resistance forming near the low‑$50s. Because the Fed is data‑dependent, a weaker jobs report or softer inflation readings could quickly reduce the odds of a December hike and allow precious metals to recover. For now, markets have pushed up the probability of tighter policy, and both metals—silver in particular—are reflecting that shift.
Monitor live spot prices and real‑time market commentary to track how these trends evolve through the coming sessions. Short‑term volatility is likely while traders digest economic releases and central‑bank signals, but the longer‑term drivers for precious metals remain centered on monetary policy, inflation expectations and supply‑demand dynamics in physical markets.
SOURCES
1. Quartz — Gold Slips to a 4‑Month Low as Inflation Raises Fears of a Fed Interest Rate Hike
2. XTB Market Analysis — Fed Holds, EUR/USD Gains
3. IANS — Gold, Silver Decline on Hawkish Fed Signals Ahead of Festive Buying
4. Economies.com — Gold Falls Below $4,000 as Silver Extends Losses Amid Fed Rate Hike Concerns
5. CME Group — Gold Futures Settlement Prices
6. LBMA — Precious Metal Prices
7. U.S. Bureau of Economic Analysis — Gross Domestic Product, Third Quarter 2026 (Advance Estimate)
8. Silver Institute — World Silver Survey 2026
9. FRED — 10‑Year Treasury Inflation‑Indexed Security, Constant Maturity (DFII10)
Disclaimer: This article is for informational purposes only and does not constitute investment advice. Past performance is not indicative of future results. Consult a qualified financial advisor before making investment decisions.
You May Also Like:
- China Gold Imports via Hong Kong: Up Over 28%, Demand Mixed
- World Bank Precious Metals Outlook: 2027 Forecast
- Silver Tests Its 2026 Low Again
- Gold Price Today: Does It Rise or Fall in an AI Stock Selloff?
- Durable Goods Beat: What It Means for Gold Price Today
- Gold Steadies Near $4,000 as Fed Week Begins
- Russia Is Selling Gold: Why That’s Not Bearish
- Gold‑Silver Ratio Today: Why Silver Is Falling Faster
- Gold Priced in Oil: What an Ounce Buys
- Social Security’s 3.6% Raise Arrives Late by Design
Popular Topics
Picked from the archive
-
01
 Topics
Why Investors Choose the Vienna Philharmonic Gold Coin
-
02
Topics
Stablecoin Issuer Outspent Central Banks on Gold Last Year
-
03
Topics
Why Gold Prices Are Falling Amid the Oil War
-
04
Topics
How to Buy Gold in 2026: Step-by-Step Guide for Beginners
-
05
Topics
Silver Appears Weak, Silver-to-Gold Ratio Signals Accumulation
-
06
Topics
Why Gold Prices Are Falling: What Most Investors Get Wrong
-
07
Topics
Should You Still Hold Gold in Your Portfolio?
-
08
Topics
Gold Bars vs Jewelry: Why Investors Choose Bullion