Why Silver Fell 6.8% in Nine Days: Real Yields, Not Inflation

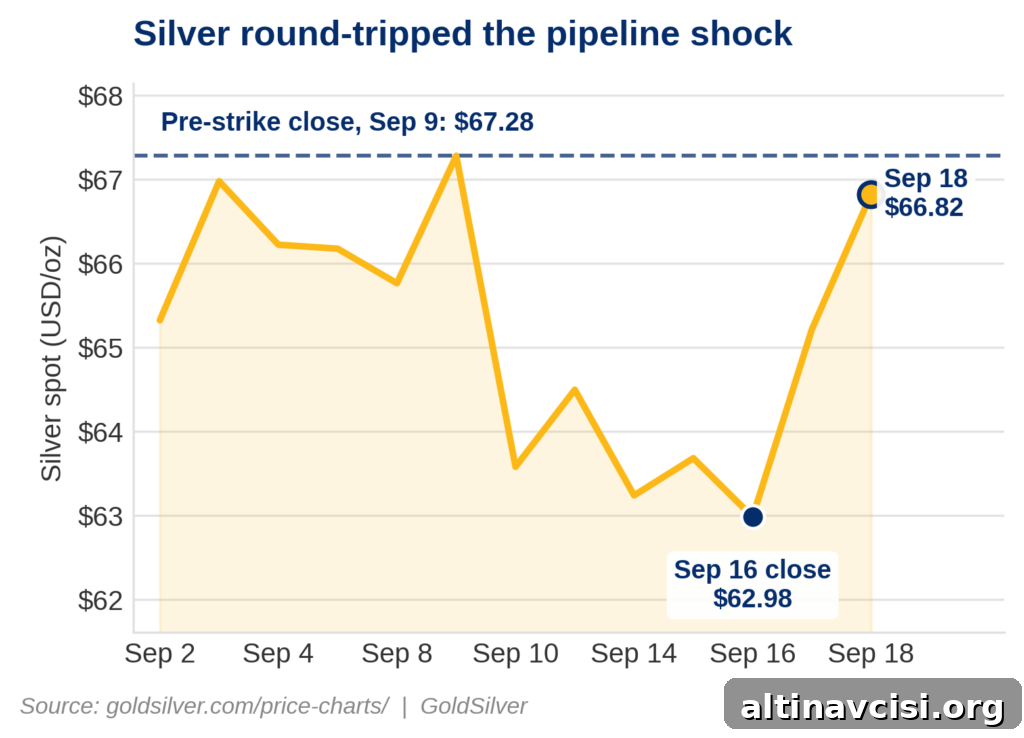
Silver closed at $67.28 per ounce on September 9. In the following nine days the market saw a drone strike on Saudi Arabia’s largest oil pipeline, Treasury yields reach levels not seen since 2007, the Federal Reserve raised interest rates for the first time in more than three years, and a tanker was struck in the Strait of Hormuz. After all that volatility, silver is trading only marginally below its pre-event close — a reminder that sharp headlines do not always translate into lasting price moves.
On Friday, September 18 at 18:45 UTC, silver was trading near $66.54 per ounce, up roughly 2.0% for the session. Gold traded near $4,381, up about 0.9%. The recent bounce in silver came not from easing inflation expectations but from a decline in real yields, as falling oil prices pushed nominal Treasury yields down from multi-year highs. For non-yielding assets like gold and silver, the relevant competition is the real return on bonds; when that real return falls, precious metals become comparatively more attractive.
Key Takeaways:
- Both gold and silver are within roughly 1% of their September 9 closes, meaning the pipeline shock largely round-tripped.
- The selloff earlier in the period reflected rising real yields, not a persistent inflation scare: from September 9 to September 16 the 10-year real yield rose while the breakeven inflation rate fell slightly.
- Silver has historically behaved as a higher-beta version of gold and moved about twice as much in both directions during the episode, consistent with a change in real yields rather than a metal-specific narrative.
Why did silver go up today?
Oil prices fell for a third consecutive session after Saudi Arabia announced plans to restart part of its East–West pipeline within days and restore the full line over a number of weeks. That repair schedule comes from Riyadh’s assessment of its own damage and should be treated cautiously, but the announcement removed some of the acute supply premium that had been priced into crude. Brent eased from intraday highs around $108.59 on September 16 to roughly $102 per barrel, and the retreat in oil helped pull nominal Treasury yields down from multi-year peaks. Lower nominal yields translated into lower real yields, making silver — which pays no yield — relatively more attractive and prompting the recent price rebound.
Did silver break out, or just recover?
It was a recovery, not a structural breakout. Media reports focused on silver escaping a $63–$64 range, but that range was created by the shock and represented just a few sessions of trading. Silver’s low was $62.68 on September 16, about 6.8% below the September 9 close of $67.28. The metal has recovered most of that decline but remains slightly below the pre-shock level. The gold–silver ratio tells the same story: about 65.4 before the strike, widening to 67.7 at the trough, and returning to the mid-60s on the rebound. These moves are characteristic of a short-lived repricing rather than a durable change in trend.
Why is the inflation explanation wrong?
The common narrative — that metals fell because of an inflation scare tied to higher oil — doesn’t fit the data for the period from September 9 to September 16. Over that interval:
- The 10-year Treasury yield rose from 4.83% to 5.01%.
- The 10-year real yield (from inflation-protected Treasuries) rose from 2.46% to 2.68%.
- The 10-year breakeven inflation rate, which equals the difference between nominal and real yields and represents the market’s inflation expectation, fell slightly from 2.37% to 2.33%.
If higher oil prices had driven an inflation scare, breakeven inflation would have increased. Instead, breakevens declined while real yields climbed by 22 basis points. That rise in real yields — the cash-like return investors can secure after inflation — is the direct competitor to non-yielding metals. Silver and gold fell because holding them became more costly in real terms; they rallied when real yields eased back down.
Why did silver move twice as much as gold?
Silver is the higher-beta metal relative to gold, and its positioning amplified moves on both the downside and the rebound. Commitments of Traders data for the week ending September 8 showed silver’s net speculative long at a much smaller share of open interest compared with gold, indicating less concentrated positioning in silver and greater sensitivity to shifts in sentiment and rates. Into the September 16 close silver had fallen about 6.4% versus gold’s 3.1%; on the recovery, silver roughly doubled gold’s return. This pattern is consistent with a real-yield driven re-pricing where silver magnifies the move.
Why do real yields matter more than headlines?
Real yields determine the opportunity cost of holding non-yielding assets. Gold and silver do not pay interest or dividends, so they compete directly with cash and inflation-adjusted bond returns. When the real return on bonds rises, precious metals typically weaken; when real returns fall, they gain. Headlines — even dramatic ones about pipelines or tanker strikes — matter only to the extent they change market expectations for real yields. In this episode the headlines were loud, but the decisive market action was a 22-basis-point swing in the 10-year real yield.
Looking ahead, two factors will be most important: whether the pipeline repair schedule proceeds as Saudi Arabia described, and whether the 10-year real yield stays below the 2.68% level reached on September 16. The path of real yields should be the primary lens through which investors watch gold and silver in the near term.
Spot prices quoted as of 18:45 UTC, September 18, 2026. Historical references compare moves to the September 9 and September 16 closes.
SOURCES
1. GoldSilver – Silver Price Charts (18 September 2026)
2. Federal Reserve – 10-Year Treasury Yield (observations 9 and 16 September 2026)
3. Federal Reserve – 10-Year TIPS Yield (observations 9 and 16 September 2026)
4. Federal Reserve – 10-Year Breakeven Inflation Rate (observations 9 and 16 September 2026)
5. Commodity Futures Trading Commission – Commitments of Traders (report week ending 8 September 2026)
6. Federal Reserve – FOMC Statement and Summary of Economic Projections (16 September 2026)
7. News outlets reporting on the Saudi East–West pipeline strikes and subsequent shutdowns (reported 10–16 September 2026)
Disclaimer: This content is informational only and does not constitute investment advice. Past performance is not indicative of future results. Consult a qualified financial advisor before making investment decisions.
You May Also Like:
- Iran Hit a Tanker in Hormuz and Trump Threatened Iran. Oil Isn’t Reacting.
- Rates Just Went Up Twice. Five Reasons Gold Didn’t Care.
- The Bank of Japan Just Hiked to a 31-Year High. Gold Barely Noticed.
- The Fed Hiked. The Bank of England Held. They Landed on the Same Rate.
- Jobless Claims Just Beat Estimates. Gold Rallied Anyway. Here Are Four More Signals Behind It.
- Gold and Silver Rip Higher as the Fed-Hike Selloff Reverses.
- The Fed Just Hiked. Sixteen of Eighteen Officials Say It’s Not Done.
Popular Topics
Picked from the archive
-
01
 Topics
Major Banks Now Converge on 2026 Gold Price Near $4,500
-
02
Topics
Gold Prices Ahead of April 29 FOMC: What Traders Should Watch
-
03
Topics
Should You Buy Gold Now During a Dip? Timing and Risks
-
04
Topics
Gold Allocation Calculator: How Much Gold Should You Hold?
-
05
Topics
Silver vs Gold 2026-2031: 5-Year Investment Outlook
-
06
Topics
How a Copper Mine Skipping Silver Explains the Deficit
-
07
Topics
Why Central Banks’ Purchase of 39 Tonnes of Gold Matters
-
08
Topics
Why Silver Jumped 6% Before Trump Xi Summit