July 2026 Silver Outlook: Two Catalysts Set to Move Prices
Key Takeaways
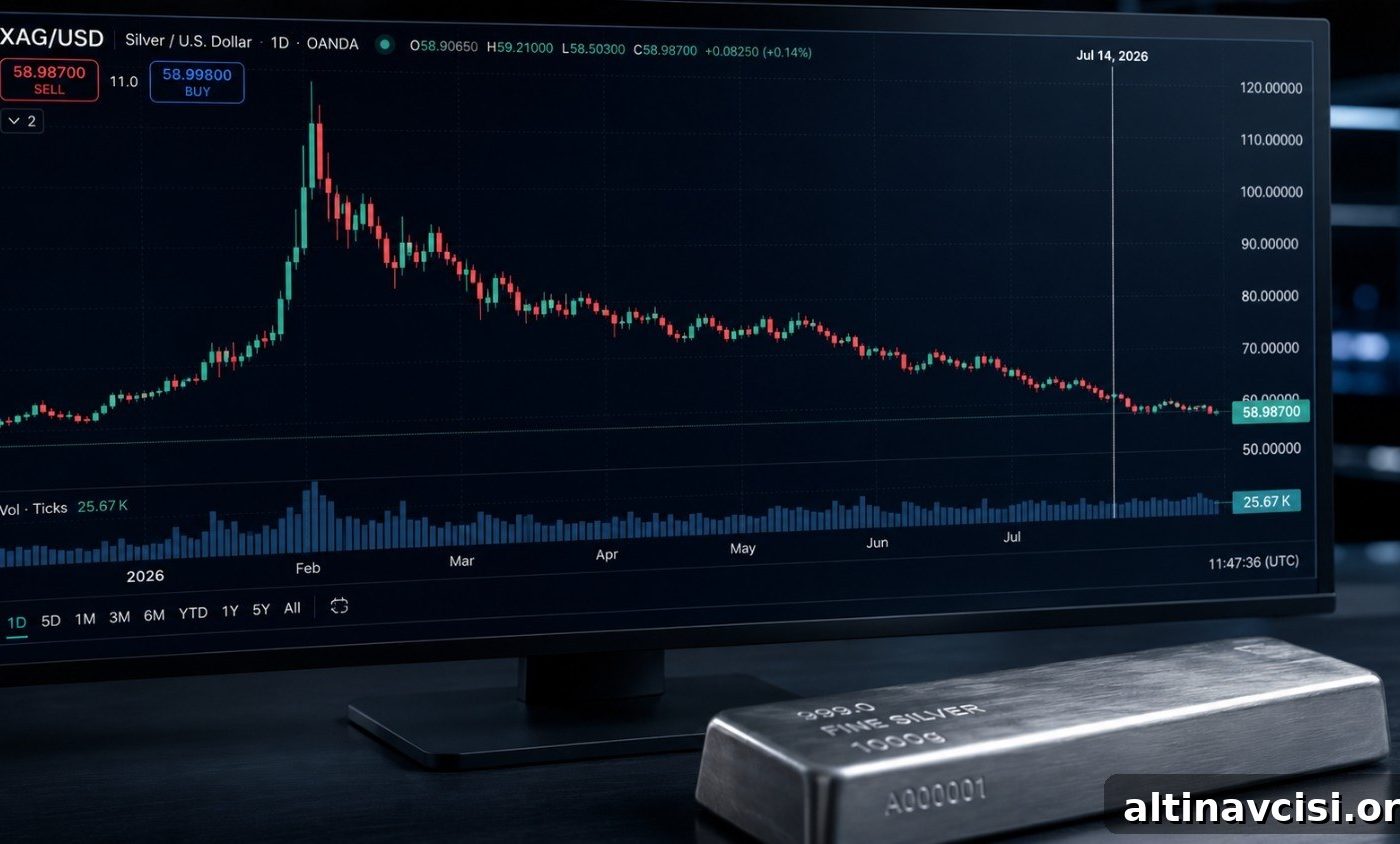
- Silver traded at $58.55 on July 14, 2026 — roughly 52% below the January all-time high of $121.62.
- The gold-silver ratio stood near 69.2:1, close to the upper end of its 50-year historical range, indicating silver is undervalued relative to gold.
- June CPI slowed to 3.5% year-over-year — down from May’s 4.2% and marking the first monthly decline since April 2020. That print was supportive for silver.
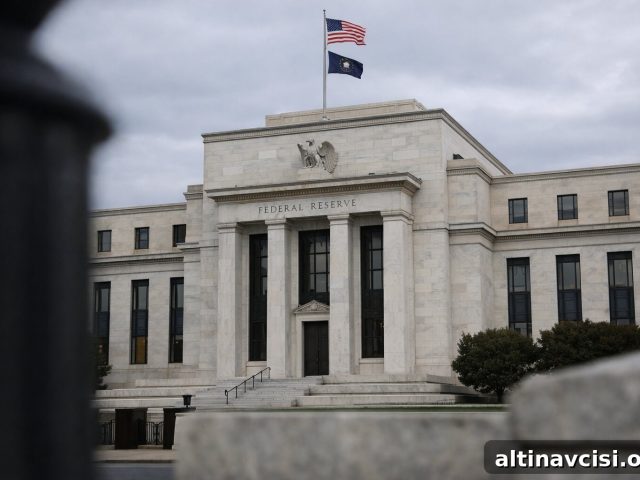
- The Federal Open Market Committee meets July 28–29. A decision to hold rates would ease real-yield pressure on silver; a surprise hike would increase it.
- The structural supply-demand story remains intact: the market recorded its sixth consecutive annual supply deficit, with a 46.3 million ounce shortfall and roughly 58% of demand coming from industrial uses.
- Major analyst consensus figures remain notably above spot: the LBMA 2026 analyst consensus is $79.57/oz and JPMorgan’s base case is $81/oz.
The silver outlook heading into July 2026 begins with a spot price around $58.55 per ounce — a sizable retracement from the January peak of $121.62. Instead of dwelling on the price peak, the key questions are how recent macro data and upcoming central bank decisions will influence silver’s trajectory in the near term.
Silver Spot Price — Last 30 Days
USD per troy ounce | Jun 15 – Jul 14, 2026
Source: goldsilver.com/price-charts | Highlighted dates include the Jun 17 FOMC decision, Jul 8 FOMC minutes, and the Jul 14 June CPI release.
Why Is Silver Down So Much From Its January High?
Three main forces explain the fall from $121.62 to current levels, and each one is rooted in measurable macro dynamics. First, the Fed’s June meeting signaled division among policymakers. That split — with several officials still favoring additional hikes and others calling for no change — supported a reassessment of rate expectations and pushed real Treasury yields higher. Higher real yields increase the opportunity cost of holding non-yielding assets like physical silver.
Second, May’s CPI reading came in hot at 4.2% year-over-year, reinforcing a hawkish Fed stance at the time and strengthening expectations for further tightening. Third, silver’s large industrial component — roughly 58% of total demand — makes it more exposed to slowing economic activity than gold, which is driven more by monetary and safe-haven demand. Together, these factors widened the gold-silver ratio from about 55:1 in May to near 69:1 in mid-July.
Crucially, these market-driven repricings altered price but have not changed the underlying supply-demand fundamentals that support silver over the medium term.
The Knowledge That Changes Everything
Two concise guides — free. Learn why gold matters and why fiat currencies have persistent vulnerabilities.
What Does June CPI Mean for the Silver Price Right Now?
The June CPI report, released July 14, 2026, surprised to the downside. Headline CPI fell 0.4% month-over-month — the largest monthly decline since April 2020 — and slowed to 3.5% year-over-year from 4.2% in May. Core CPI also eased, moving down to 2.6% from 2.9%. Lower inflation reduces the immediate pressure for more aggressive Fed tightening.
The mechanism is straightforward: easing inflation lowers the odds of additional rate hikes, which tends to reduce real yields. When real yields fall, the relative cost of holding non-yielding assets like silver declines, supporting price gains. The market reacted accordingly: silver rose intraday on the release and settled higher than the pre-print level, illustrating this mechanism in real time.
Although the June report is supportive, it is not definitive on its own. Still, it is the most important near-term data point ahead of the July 28–29 FOMC meeting and points toward a more favorable environment for silver.
What Does the July 28–29 FOMC Meeting Mean for Silver?
The Fed’s July decision is scheduled for July 29, 2026. This meeting does not include a new dot plot or Summary of Economic Projections, so market participants will be parsing the chair’s press conference for signals about the outlook into September. With June’s softer CPI print, market odds have shifted toward a decision to hold rates. A hold would alleviate some real-yield pressure on silver; a surprise hike would extend upward pressure on real yields and could weigh on silver.
Fiscal constraints also matter: the size of U.S. debt and rising interest costs limit how far policy can tighten without increasing borrowing burdens. These considerations create a backdrop in which a restraint on further aggressive rate hikes is plausible, a dynamic that would be silver-positive if it persists.
Is the Silver Supply Deficit Still Relevant in July 2026?
Yes. The market’s structural shortage has not disappeared with the price correction. The World Silver Survey 2026 reported the sixth consecutive annual supply deficit at 46.3 million ounces, wider than the 2025 shortfall. Since 2021, cumulative withdrawals from above-ground stocks have totaled hundreds of millions of ounces, underscoring the persistent imbalance.
Mine production remains effectively flat at current levels because the majority of silver is produced as a byproduct of base-metal mining. Base-metal economics, not silver prices, largely determine output. At the same time, steady growth in industrial end uses — including solar photovoltaics, electric vehicles, semiconductors, and data-center technologies — continues to exert structural demand pressure that does not quickly recede when prices dip.
What Does the Gold-Silver Ratio Signal in July 2026?
The gold-silver ratio near 69.2:1 means it takes roughly 69 ounces of silver to equal one ounce of gold. That level is near the high end of the modern 50-year range and historically has often preceded periods where silver outperforms gold. For context, the ratio fell to about 55:1 in May before widening again amid hawkish Fed pricing.
Using the contemporaneous gold price as a reference, a moderate compression of the ratio would imply a materially higher silver price than spot. While the ratio is a valuation tool rather than a strict forecast, its current level suggests silver is inexpensive relative to gold on a historical basis.
Where Do Analysts See the Silver Price Heading?
Major surveys and bank outlooks remain well above current spot levels. The LBMA’s 2026 survey of analysts produced a full-year consensus around $79.57 per ounce. JPMorgan’s base case sits near $81 per ounce. Other institutions have midpoint views clustered in the mid-to-high $70s or higher, with upside scenarios extending into the $80s and beyond if industrial demand remains robust. Notably, these projections were issued before the recent correction, and most forecasters have not adjusted their full-year averages below current spot prices.
Stay On Top of Gold & Silver Prices
Get important market alerts sent straight to your inbox.
People Also Ask
What is the silver price today in July 2026?
On July 14, 2026 silver traded at approximately $58.55 per ounce. Intraday ranges around that date were roughly $56.87 to $59.68, and silver rose on the day the June CPI print came in softer than expected.
What is the gold-silver ratio right now?
The gold-silver ratio was about 69.2:1 in mid-July 2026, placing it near the high end of its modern 50-year range. Historically, ratios this elevated have often preceded periods when silver outperforms.
Is the silver supply deficit still happening in 2026?
Yes. The World Silver Survey 2026 confirmed a continuing annual supply deficit, estimated at 46.3 million ounces for the year, marking six consecutive years of deficits and ongoing withdrawals from above-ground inventories.
What do analysts forecast for the silver price in 2026?
Analyst consensus figures cluster well above spot: LBMA’s survey averaged $79.57/oz, JPMorgan’s base case near $81/oz, and other large institutions with midpoint targets in a similar range. These forecasts were issued before the price correction and generally remain higher than current levels.
How does the July 28–29 FOMC meeting affect silver?
Because the July meeting does not include a new dot plot or economic projections, markets will focus on the chair’s language for signals about September. A decision to hold or dovish wording would relieve some real-yield pressure and be supportive for silver; a surprise hike would likely extend the pressure that has weighed on prices.
SOURCES
Federal Reserve — FOMC Summary of Economic Projections, June 17, 2026
Bureau of Labor Statistics — Consumer Price Index summary, June 2026 (released July 14, 2026)
Bureau of Labor Statistics — Consumer Price Index summary, May 2026
Silver Institute / Metals Focus — World Silver Survey 2026 (April 15, 2026)
J.P. Morgan Global Research — Silver prices outlook 2026
GoldSilver — live gold and silver spot prices and charts, July 14, 2026
LBMA — 2026 Annual Precious Metals Forecast Survey
U.S. Treasury Fiscal Data — debt and interest expense data, early July 2026
Disclaimer: This article is for informational purposes only and does not constitute financial or investment advice. Consult a qualified financial adviser before making investment decisions.
You May Also Like:
- Why the 10-5-3 Rule Fails Gold and Silver Investors
- Why Is Silver So Hard to Mine? The Primary Supply Problem Explained
- Gold Price Outlook July 2026: The Price Fell. Case Intact.
- Buying the Top: A Survival Guide for Gold and Silver Investors
- How Do Gold Price Cycles Work? A Framework Across Four Time Horizons
- The $300 Billion Lesson: What Frozen Reserves Taught Central Banks About Gold
- How To Perform Silver Technical Analysis (in 5 Steps)
Popular Topics
Picked from the archive
-
01
 Topics
Gold Price Cycles Explained: A Four-Time-Horizon Framework
-
02
Topics
Gold Repricing Underway: 5 Major Institutions Confirm
-
03
Topics
How Dalio, Buffett and Jim Rogers Invest in Gold
-
04
Topics
How Gold Prices Move During a US Dollar Crash
-
05
Topics
5 Factors That Drive Gold Spot Prices
-
06
Topics
August CPI: Sticky Inflation Unlikely to Stop Fed Rate Cuts
-
07
Topics
Institutions Are Buying as Bond Yields Rise: What It Means
-
08
Topics
Why a Stalled Federal Reserve Matters for Gold Prices