Gold Rally Sends Two Winners Soaring, One Isn’t Metal
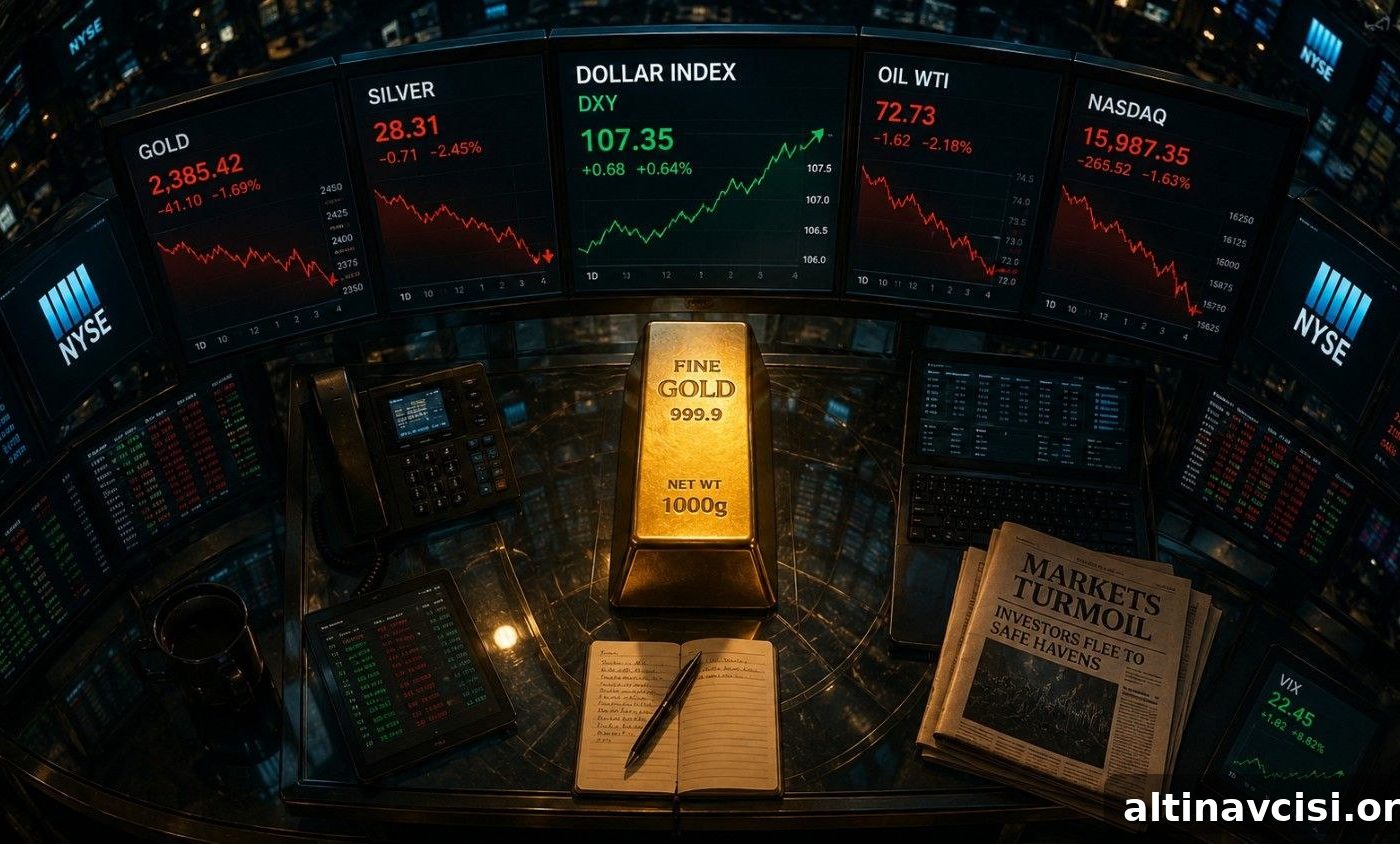
Spot prices for precious metals declined today for two distinct, unrelated reasons. First, a sudden semiconductor selloff forced institutional traders to liquidate profitable positions — including holdings in paper gold and silver — to cover losses in equities and meet margin requirements. Second, the Federal Reserve’s hawkish June 17 dot plot pushed real yields higher, increasing the opportunity cost of holding a non-yielding asset such as physical gold. Neither development changes the fundamental long-term case for owning physical gold; they are short-term market drivers that affect paper-market pricing and liquidity.
On Wednesday morning, spot gold traded down to $4,020 per ounce, the lowest level in roughly two weeks. Silver fell to about $59.13, a decline near 4%, and the gold-silver ratio widened to approximately 68-to-1. Those moves reflect forced selling and higher competing yields rather than a shift in the structural demand for physical metal.
Why Is Gold Falling Today?
The immediate trigger for today’s drop is the semiconductor selloff that began in South Korea and quickly spread through global equity markets. When traders suffer sharp losses in fast-moving equity positions, the typical response is to sell liquid, profitable assets to generate cash and reduce exposure. Gold and silver — which were strong performers earlier in the year — are often logical choices for that quick liquidation because futures and ETF positions can be closed rapidly.
This is a liquidity-driven repricing rather than a value-based reassessment of gold. Institutional models will sell assets that show gains and high liquidity to meet margin calls or rebalance portfolios, regardless of their longer-term outlook. In this case, precious metals got trimmed alongside other winners in a crowded trade as semiconductor stocks and related indexes experienced unusually large declines.
Put simply: sellers are solving balance-sheet problems, not arguing that the intrinsic case for physical gold has deteriorated relative to the dollar. The correction reflects market mechanics — forced selling, stop-losses, and portfolio rebalancing — more than a change in gold’s structural attractiveness.

The Edge Every Investor NeedsSmarter precious metals investing starts with timely insights. Sign up for concise market updates, Fed commentary, and educational analysis to stay informed.
Is the Rate-Hike Pressure on Gold Separate From the Chip Selloff?
Yes — the chip selloff is the proximate cause of the intraday move, but separate, persistent monetary forces are also at work. The Federal Reserve’s June projections signaled that a significant share of officials expect further tightening before year-end. That outlook has been reinforced by major banks adjusting their rate forecasts and by pricing in the federal funds futures market.
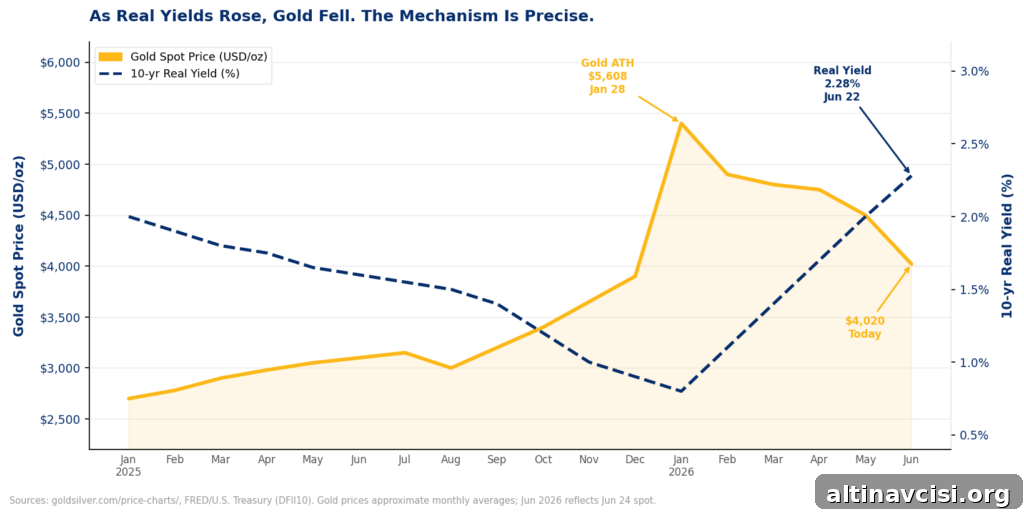
Real yields on the 10-year TIPS have risen materially, and this matters because real yields represent a government-guaranteed return above inflation. Physical gold provides no coupon. As real yields climb, the relative attractiveness of non-yielding assets can decline in institutional allocation models, which leads some investors to reduce exposure to gold and other precious metals in favor of income-bearing instruments.
What Are the Two Catalysts That Will Determine Gold’s Direction This Week?
Two near-term events will likely determine whether the current selling pressure eases or intensifies: a major chip company’s earnings report tonight and the Federal Reserve’s preferred inflation gauge due tomorrow morning.
Micron earnings, after the close tonight: Market participants will watch not just the headline earnings and revenue numbers but also forward guidance. Strong results and positive guidance that confirm ongoing AI-driven memory demand could stabilize the semiconductor sector and relieve some of the forced liquidation pressure that has weighed on metals. Conversely, weak guidance would likely extend selling across correlated assets, keeping metal prices under pressure.
May core PCE, Thursday 8:30 AM ET: The core Personal Consumption Expenditures (PCE) index is the Fed’s preferred inflation measure. A hotter-than-expected print would support a higher-for-longer rate narrative, boost the US dollar and real yields, and likely extend downward pressure on precious metals. A softer print would reduce the probability of additional rate hikes and give metals more room to recover. In short, PCE will influence the Fed’s expected path and therefore the market’s view of real yields.
What This Means for Physical Metal Holders
Physical metal holders are insulated from margin calls and many forms of forced liquidation. The recent moves are primarily happening in paper markets — futures, ETFs, and other traded vehicles — where leverage and margin mechanics drive rapid flows. Physical gold owners who purchased for long-term, structural reasons are not directly affected by intraday paper-market volatility.
Fundamentally, central bank purchases, mining supply constraints, and longer-term monetary conditions remain key drivers of physical demand. Short-term drawdowns do not erase those drivers. While spot prices can and do fluctuate to reflect liquidity needs and changing interest-rate expectations, the underlying case for holding physical gold — as a hedge against currency debasement, fiscal imbalances, and inflation risk — remains intact for many investors.
The recent correction from the January peak to current levels represents a significant pullback. It stemmed from an oil-driven inflation spike earlier in the year and a subsequent repricing of Fed policy. Both factors can be transitory: oil supply dynamics can shift, and the Fed’s path depends on incoming data. For long-term physical metal holders, price volatility is distinct from an alteration in the structural rationale for ownership.
Watch tonight’s semiconductor earnings and Thursday’s PCE release. These two events are likely to dictate whether this week’s market action marks a bottom or signals further pressure for paper-priced precious metals.
SOURCES
1. GoldSilver — Gold & Silver Spot Prices, June 24, 2026
2. FRED/Federal Reserve — 10-Year Treasury Constant Maturity, June 22, 2026
3. FRED/Federal Reserve — 10-Year TIPS Real Yield, June 22, 2026
4. Federal Reserve — Summary of Economic Projections, June 17, 2026
5. Reports on updated bank forecasts and market commentary, June 2026
6. Market coverage of semiconductor index moves and Micron stock performance, June 23–24, 2026
Disclaimer: This article is for informational purposes only and does not constitute financial or investment advice. Consult a qualified financial adviser before making investment decisions.
You May Also Like:
- Why Is Silver Down? The Gold-Silver Ratio Explained
- How Rate-Hike Expectations Are Being Priced into Precious Metals
- Geopolitical Developments, Oil Supply, and What They Mean for Gold
- Why the PCE Report Matters for Gold and Real Yields
Popular Topics
Picked from the archive
-
01
 Topics
Gold Price Hits $5,000: Could the Rally Continue?
-
02
Topics
How Quantitative Easing Affects Gold, Silver and Industrial Metals
-
03
Topics
JPMorgan Predicts $6,300 Gold Price After Historic Crash
-
04
Topics
Gold vs Inflation: What 100 Years of Data Reveals
-
05
Topics
How to Dollar-Cost Average into Gold and Silver
-
06
Topics
Why Gold Soared 40% This Year After Moody’s Downgrade
-
07
Topics
China’s Biggest Gold Buy Since 2023 as Prices Fall 16%
-
08
Topics
Why Gold Prices Are Falling Despite Global Turmoil