Goldman Sachs Overhauls Business Model — Time to Update Yours?
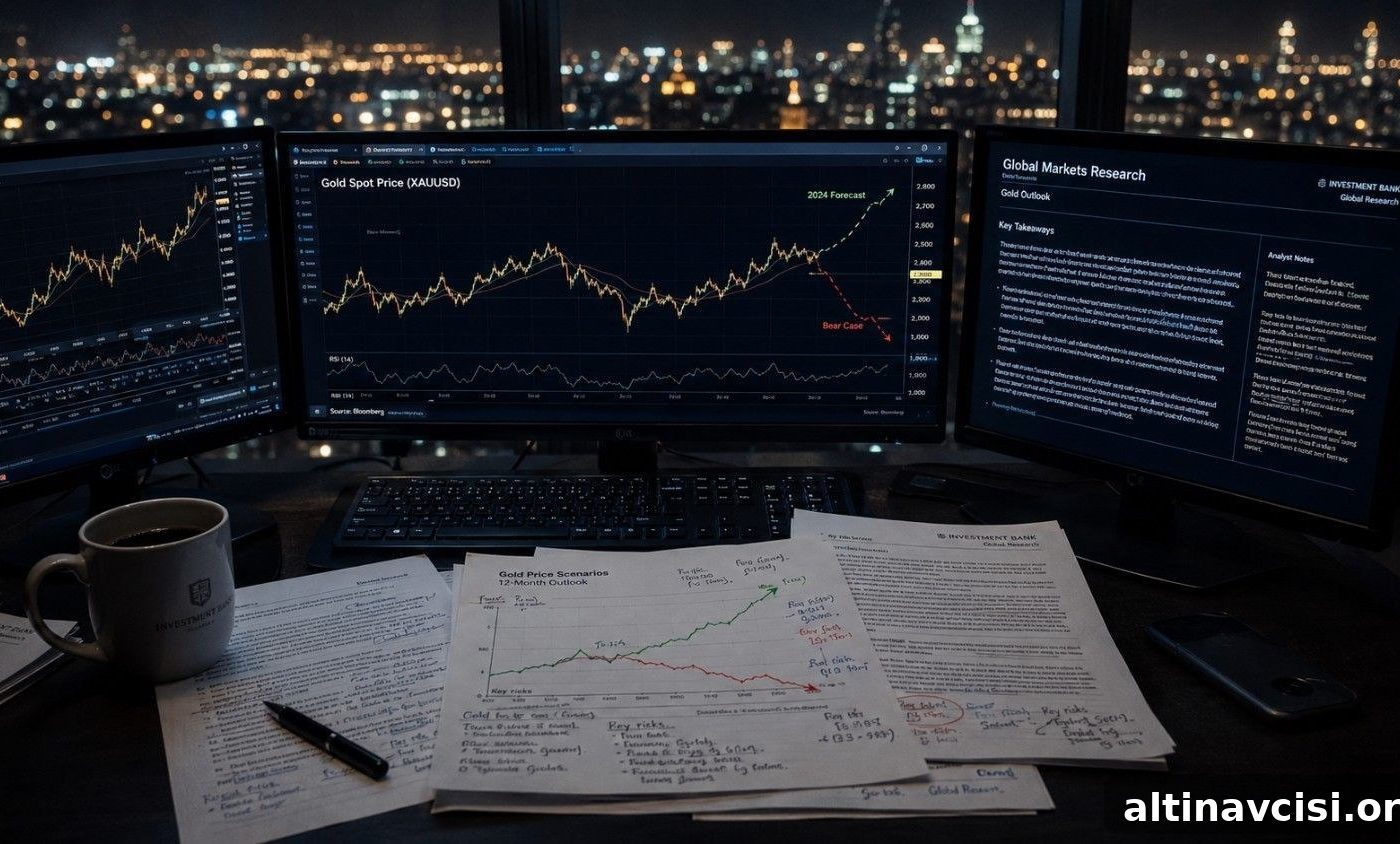
On June 19, Goldman Sachs reduced its year-end gold target from $5,400 to $4,900. Other major banks kept higher forecasts: JPMorgan remained at $6,000, Wells Fargo at a $6,100–$6,300 range, and Deutsche Bank at $6,000. Goldman’s own downside scenario is $4,400. That leaves a $1,100 gap between the most conservative and the most bullish large-bank forecasts — a divergence that reflects competing views about what gold actually is as an asset.
Whether Goldman’s revision matters for your portfolio depends on which model of gold you subscribe to. Goldman’s cut is the logical output of a rate-driven model: it is not a blanket bearish verdict, merely the result of a specific set of inputs. Other institutions use different inputs and therefore reach different conclusions. Understanding those frameworks will help you decide which signals to follow.
Why Goldman’s Model Produced a $500 Cut
Goldman’s forecast is built around interest-rate expectations. Analysts Lina Thomas and Daan Struyven quantify the link: roughly every 50 basis points of Federal Reserve easing adds about $120 an ounce to gold’s price, working through a lower opportunity cost for holding a non-yielding asset and a weaker dollar. When Goldman published a $5,400 target in January 2026, that path included two Fed cuts: one late in 2026 and another in early 2027.
After the June 17 FOMC meeting — the first under Chair Kevin Warsh — forward guidance was removed from the statement and several policymakers signaled a more hawkish stance. Goldman’s economists shifted their assumptions: both previously expected 2026 cuts were pushed out into 2027. Using Goldman’s sensitivity rule, removing two 25bp cuts (50bp total) reduces model support by roughly $120 per ounce. The rest of the $500 revision came from lowering expected ETF inflows. Goldman’s language summarized the result as “structurally constructive but tactically cautious.” The bank did not abandon the structural bull case; it adjusted the near-term rate-path input.
The Knowledge That Changes Everything
Two essential guides — free: a practical gold buying guide and a primer on the long-term risks of fiat currency. Useful background for anyone considering a gold allocation.
What JPMorgan’s Model Focuses On
JPMorgan’s $6,000 year-end target is rooted in a different premise: demand tonnage. Their research finds that changes in quarterly gold demand — central banks, ETFs, and physical buyers — explain roughly 70% of quarter-to-quarter price moves. On that measure, little has shifted. Central banks bought an estimated 244 tonnes in Q1 2026 and many continue to add reserves. China’s central bank has been a steady buyer, and the World Gold Council’s surveys indicate a large share of central banks plan to grow reserves rather than shrink them.
Those reserve managers make decisions on long timelines. They do not pivot their reserve policy based on a single Fed meeting or the FOMC dot plot. From JPMorgan’s perspective, the structural demand floor remains intact; rate-policy shifts matter at the margin but do not displace committed sovereign and institutional buyers.
Major Bank Gold Price Targets — Year-End 2026
Goldman Sachs reduced its target on June 19. Other major banks held higher targets.
- Wells Fargo: $6,100–$6,300 per ounce (midpoint shown elsewhere as $6,200)
- JPMorgan: $6,000 per ounce
- Deutsche Bank: $6,000 per ounce
- Goldman Sachs: revised to $4,900 per ounce (previously $5,400); downside scenario $4,400
Sources: public research notes from major banks and public demand data.
Which Framework Matches Your Investment Thesis?
Both Goldman and JPMorgan can be internally correct because they answer different questions. Goldman treats gold as a macro asset whose value moves with the interest-rate cycle and the dollar. JPMorgan treats gold primarily as a reserve and demand-driven asset, moved by cumulative tonnage from committed buyers. Your decision depends on whether you hold gold tactically (to express views on rates or the dollar) or structurally (as a reserve, purchasing-power hedge, or long-term insurance).
Your Model Might Not Match Either Bank’s
There is a third perspective that overlaps with both: the so-called “debasement trade.” Large institutions now reference this thesis, which posits that persistent fiscal deficits and rising government interest costs erode the purchasing power of fiat currencies over multi-year horizons. Investors who buy into the debasement thesis are focused on a 5–10 year horizon and are largely indifferent to whether the first Fed rate cut comes in late 2026 or mid-2027. For them, a single FOMC dot-plot revision is immaterial.
This framing has moved from niche jargon into mainstream institutional research. That institutional validation matters, but it does not automatically make the thesis right for every investor. The key question remains: which time horizon and drivers align with your reasons for holding gold?
What to Watch If Goldman’s Rate-Sensitive Model Is Yours
If your gold exposure is driven by rate-cycle views, monitor three indicators closely: (1) CME FedWatch probabilities for each FOMC meeting, (2) the 10-year real yield (nominal 10-year Treasury yield minus inflation expectations), and (3) upcoming core PCE and CPI releases. Goldman’s model is sensitive to shifts in the expected timing and magnitude of Fed easing. Under that framework, the recent shift toward a more hawkish Fed posture weakens the gold thesis for 2026 and makes Goldman’s cut a relevant signal to trim or delay new allocations.
What to Watch If JPMorgan’s or the Debasement Model Is Yours
If you own gold as a reserve asset or as protection against long-term currency debasement, prioritize reserve and supply-side data: monthly World Gold Council central bank purchase reports, PBOC reserve disclosures, the pace of ETF inflows, and the U.S. fiscal deficit as a share of GDP. These indicators speak to structural absorption of supply and long-term reserve accumulation — the core drivers in demand-tonnage and debasement frameworks. In those views, Goldman’s near-term tactical revision is far less consequential.
The Persistent Floor Gold Is Demonstrating
A useful reality check: real yields are historically restrictive today, which normally pressures gold because the opportunity cost of holding a non-yielding asset rises. Yet gold has remained well above Goldman’s downside scenario and near or above the revised target in mid‑June, indicating that a non-rate-sensitive buyer base — central banks, physical demand and long-term allocators — is absorbing supply. That persistence illustrates why different models can reach different conclusions at the same time.
Two Different Watches, Two Different Dials
Goldman’s cut is not a final judgment on gold; it is a reasoned model update based on a changed interest-rate path. If your thesis is rate-sensitive, treat that revision as meaningful. If your thesis is structural or focused on reserve accumulation and debasement risk, the practical drivers that mattered before June 19 remain unchanged. The $1,100 gap between bank forecasts reflects different theories about money, gold’s role, and appropriate time horizons. Recognizing which theory guides your allocation makes Goldman’s revision either essential or largely irrelevant to your investment decisions.
Stay On Top of Gold & Silver Prices
Receive timely market alerts and updates in your inbox.
Subscribe to curated alerts covering central bank demand, ETF flows, and rate-driven market signals to stay informed about developments that could affect your gold allocation.
People Also Ask
Why did Goldman Sachs cut its gold price forecast in June 2026?
Goldman cut its 2026 year-end target because it moved expected Fed easing out of 2026 and lowered ETF inflow assumptions. The bank’s model links each 50 basis points of Fed easing to roughly $120 per ounce of gold support; delaying two 25bp cuts removed about $120 of model support and reduced expected inflows accounted for the remainder of the $500 revision. Goldman maintained a constructive structural view but became tactically cautious based on a changed rate-path input.
Why didn’t JPMorgan lower its gold forecast when Goldman did?
JPMorgan’s forecast emphasizes demand tonnage rather than rate sensitivity. With strong central-bank buying and steady structural demand, JPMorgan’s inputs did not change materially when the Fed’s tone shifted, so its $6,000 target remained intact.
What is the “debasement trade” referenced in research?
The debasement trade is the thesis that persistent fiscal deficits and rising interest costs gradually erode fiat purchasing power, prompting long-term investors and institutions to buy gold as protection. It operates on a multi-year horizon and is largely indifferent to short-term Fed timing.
What data should a long-term gold holder watch after Goldman’s cut?
Long-term holders should track central bank purchase reports, PBOC reserve disclosures, the pace of ETF inflows, and fiscal deficit trends. These indicators reflect structural demand that is often independent of short-term rate moves.
What is the difference between Goldman’s and JPMorgan’s models?
Goldman’s model prioritizes rate sensitivity and short-term flows; JPMorgan’s prioritizes cumulative demand tonnage and reserve accumulation. The divergence in targets reflects different lenses, not contradictory facts.
Is Goldman Sachs bearish on gold after its June 2026 cut?
No. Goldman described its stance as “structurally constructive but tactically cautious.” The bank kept a positive year-end target and left the long-term structural drivers intact, while adjusting the near-term rate-path assumptions.
How does the 10-year real yield affect gold prices?
Rising real yields increase the opportunity cost of holding non-yielding gold, which usually pressures gold prices. However, if structural buyers absorb supply, gold can hold steady even when real yields are elevated.
SOURCES
1. Goldman Sachs Global Investment Research — Gold Price Target Revision, June 19, 2026
2. Federal Reserve — FOMC Statement and Summary of Economic Projections, June 17, 2026
3. JPMorgan Global Research — Gold Price Forecast, May 2026
4. World Gold Council — Gold Demand Trends Q1 2026
5. World Gold Council — Central Bank Gold Reserves Survey 2026
6. Industry reporting and public research notes cited in the article
Disclaimer: This article is informational only and does not constitute financial or investment advice. Consult a qualified financial advisor before making investment decisions.
You may also like:
- Gold Is Down 25%. Morgan Stanley Says One Number Unlocks $5,200.
- Solar Cut 19% Silver. The Deficit Widened Anyway.
- Gold Down 26%. Barclays’ $4,791 Target Never Moved.
- Gold Silver Ratio at 64: What It Signals for Silver in 2026
- How Central Banks Decide How Much Gold to Hold
- How Much Does Gold Storage Cost? The $72-a-Year Answer
- Silver Price Outlook June 2026: The Correction Was the Setup
- Wall Street’s $6,000 gold call rests on data most investors never see
Popular Topics
Picked from the archive
-
01
 Topics
Why Fed Rate Hike Odds Reached 85% and Gold Climbed
-
02
Topics
Gold Holds Steady as Central Banks Delay Rate Cuts
-
03
Topics
How Profit Booking Works in Gold and Silver
-
04
Topics
Optimize Portfolio with the 80/60 Gold-Silver Rule
-
05
Topics
Why Gold Is Outperforming Nvidia in 2025
-
06
Topics
Gold, Silver Prices Drop as Central Banks Hold Steady
-
07
Topics
How Silver Pricing Works: Spot Price, Premium and Dealer Markup
-
08
Topics
Gold Prices Fall to Seven-Month Low as Geopolitical Fear Fades