June 2026 Silver Price Outlook: Correction Sparks Rally
Key Takeaways
- Silver trades at $70.38 on June 15, 2026 — up 3.45%, outperforming gold (+2.95%), after a US–Iran ceasefire reduced oil-driven inflation pressure [LBMA spot price, June 15, 2026].
- The structural case remains intact — and is arguably stronger than in January — six consecutive global supply deficits totaling roughly 762 million cumulative ounces through 2025, with investment demand absorbing the solar sector’s pullback [Silver Institute, World Silver Survey 2026].
- The gold–silver ratio at 61.7 suggests silver is modestly undervalued — historical bull-cycle ranges of 50–65:1 imply a silver price of roughly $67–$87 given current gold levels.
- The largest immediate headwind — oil-driven inflation — is easing. Today’s ceasefire and the widely expected Federal Reserve hold for the June 16–17 meeting at 3.50–3.75% both support silver [CME FedWatch, June 15, 2026].
- Analyst forecasts are above today’s price: J.P. Morgan targets $81 for the full year, and the LBMA consensus across analysts is $79.50 — both higher than $70.38 [J.P. Morgan Global Research; LBMA 2026 Forecast Survey].
Why Doesn’t the $121 All-Time High Matter Right Now?
In our May silver outlook we warned that many investors were fixated on the January record high of $121.62 and treating the current $70 level as failure rather than opportunity. The correction altered the price, not the underlying fundamentals. Today that framing looks increasingly relevant.
As of June 15, 2026 (16:22 UTC) silver is trading at $70.38 per ounce according to LBMA spot pricing. It gained 3.45% on the day, outpacing gold, after an announced US–Iran ceasefire pushed oil prices down and eased inflation concerns that had weighed on precious metals since February.
Tomorrow the Federal Reserve begins its June 16–17 meeting under newly sworn-in Chair Kevin Warsh. Markets are overwhelmingly pricing a hold at 3.50–3.75%, but the committee’s dot plot and the chair’s press conference will shape how real yields and expectations evolve — and that outlook will be central to silver’s next move.
This June 2026 silver outlook covers where silver stands now, the three main forces that will guide its direction, and what current signals mean for patient investors.
The Knowledge That Changes Everything

Two essential guides — free: learn why gold matters and why fiat currencies eventually fail.
Where Is Silver Headed in 2026?
Most major institutional forecasters see the 2026 full-year average for silver in the $79–$81 range, above today’s $70.38. The question for markets is not whether silver can reach those levels, but which headwind — primarily oil-driven inflation or monetary policy — eases first. Today, one of those headwinds appears to be receding.
What Is Silver’s Spot Price Today?
Silver trades at $70.38 per ounce as of June 15, 2026, with an intraday range of $67.78 to $71.33. That single-day rise of $2.35 (3.45%) followed the ceasefire announcement and the associated drop in oil.
Three reference points place today’s price in context:
- 42% below the all-time high of $121.62 set on January 29, 2026.
- 143% above silver’s opening price around $29/oz in January 2025.
- Inside the consensus 2026 forecast range: J.P. Morgan $81 and LBMA consensus $79.50.
The correction from $121 to the $63–$68 zone had three main causes: higher margin requirements on silver futures that forced leveraged selling, a sharp repricing of real yields following Chair Warsh’s nomination, and profit-taking after a 147% rally in 2025. Those were pricing and positioning events; the physical supply–demand story did not change materially.
What Is the Gold–Silver Ratio Signaling?
The gold–silver ratio shows how many ounces of silver buy one ounce of gold. On June 15 it stood at 61.7, calculated from a gold price near $4,344 and silver at $70.38. Historically, a ratio in the 60–70 range has often marked a transition toward silver outperforming gold. When the ratio falls below 60, silver typically leads the advance; when it rises above 80, silver is deeply undervalued by historical bull-cycle standards.
A declining ratio — from 64 to 62 to 61 in a short span — is directional. Today’s stronger silver performance versus gold is an early sign that the market may be shifting back toward silver accumulation.
Gold–Silver Ratio (Jan–Jun 2026)
Current (June 15, 2026): 61.7 — a level that historically suggests silver is relatively inexpensive versus gold and that accumulation may be attractive as a bull phase matures.
What’s Driving Silver in June 2026?
Force 1: Does the Iran Ceasefire End Silver’s Biggest Headwind?
Since late February the US–Iran conflict pushed oil above $100 per barrel and reignited inflation fears, which in turn raised real yields and made non-yielding silver less attractive. The announced ceasefire eased oil and inflation expectations, and both gold and silver rose more than 3% in the session. If the ceasefire holds and oil normalizes, energy’s contribution to inflation could have peaked, removing a dominant suppressor of silver’s monetary premium.
Caveat: the ceasefire is fragile and markets are not pricing early rate cuts. Still, the market is beginning to price an end to further rate-hike risk — and that change of risk perception supports silver.
Force 2: What Will Warsh’s First Press Conference Mean for Silver?
The June FOMC decision is widely expected to be a hold, but the dot plot and Chair Warsh’s tone will matter. Three questions matter most: will the median projection include another hike this year; will language shift from easing bias to neutral; and will the chair call energy-driven inflation temporary or structural? A neutral tone that treats energy pressures as temporary would compress real yields and benefit silver; a hawkish tone would keep real yields elevated and cap silver’s upside.
There is a contrarian element: much of the market already priced in hawkishness earlier this year, and the largest speculative leverage that pushed silver to its January peak has been largely unwound. That means a neutral outcome could be interpreted as relatively bullish.
Force 3: Why Does the Silver Supply Deficit Matter More Than the Fed?
This is the longer-term structural story. Silver is in its sixth consecutive year of global supply deficit in 2026. The Silver Institute’s World Silver Survey estimates a 46.3 million ounce shortfall for 2026, with total demand around 1.07–1.09 billion ounces versus mine supply near 847 million ounces. Because about 70% of silver is produced as a byproduct of base metals mining, supply cannot expand quickly in response to price.
Solar manufacturers reduced silver usage per panel, and jewelry demand is lower, but higher physical investment — coins and bars — has more than offset those declines. Industrial demand tied to AI data centers, EV electronics, and automotive applications is rising, adding a persistent layer of consumption.
Every year of deficit draws down above-ground inventories. That physical depletion is meaningful: it is not a paper position but metal that has been consumed by industrial, jewelry and investment uses.
Is June 2026 a Better Entry Point Than January Was?
January’s $121 peak was driven in part by speculative leverage and margin events that have since reversed. Today’s lower price clears out much of that speculative froth, leaving physical buyers and institutional forecasts still targeting higher prices for 2026. The structural case for silver — years of deficits, rising industrial demand, and strong physical investment — is more defensible today than it was at the speculative peak.
Institutional forecasters have not significantly cut their 2026 silver targets after the correction, and the large speculative positions that exaggerated the January rally are gone. That combination makes a lower entry point more attractive to patient, long-term investors.
What Are the Bull and Bear Cases for Silver in 2026?
Bull case: The Iran ceasefire holds, oil falls and energy-driven inflation recedes; the Fed signals neutrality; physical inventory stress appears in delivery markets. Under that scenario, silver could revisit the $90–$106 range by year-end.
Bear case: The ceasefire collapses, oil spikes above $100 again, and policy stays hawkish — keeping real yields elevated and pushing silver back toward $60–$63 support, about 15% below today’s price.
Balanced view: The bear case requires simultaneous setbacks on both geopolitical and monetary fronts. With the ceasefire and the Fed’s expected hold, that double-negative outcome is less likely now than it was yesterday.
Silver Spot Price — January to June 2026
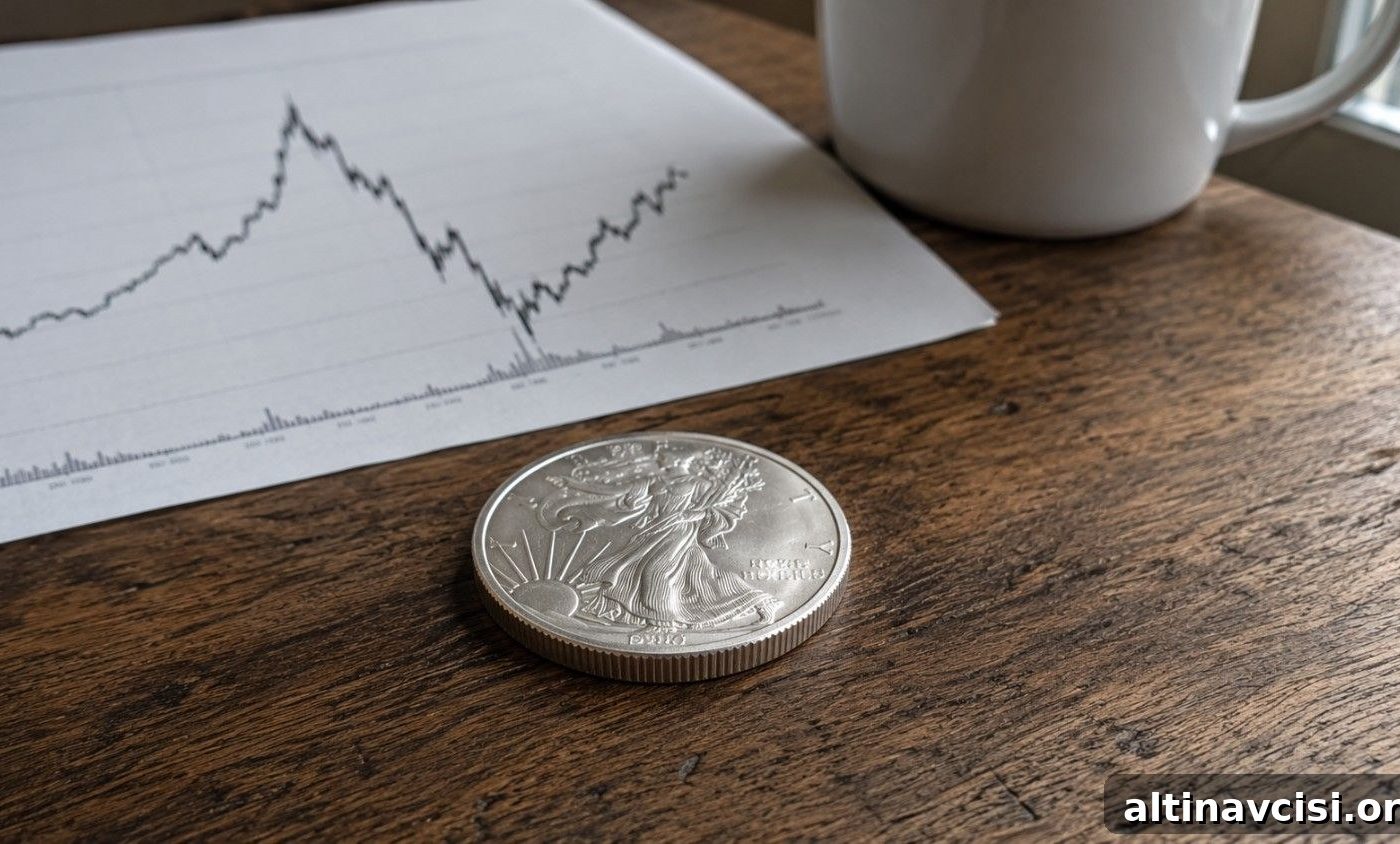
Summary: All-time high $121.62 (Jan 29); correction low near $63.9 (Feb 6); current $70.38 (Jun 15). The path reflects speculative extremes followed by consolidation and renewed physical demand.
What Does the Gold–Silver Ratio at 61.7 Tell Long-Term Investors?
A ratio of 61.7 indicates silver is relatively inexpensive versus gold by historical standards. In past bull cycles the ratio often compressed toward 40–50:1, a pattern that favors silver accumulation. At today’s gold price, a ratio in the mid-50s to 60s implies silver prices notably above current levels. The ratio is a valuation gauge, not a timing device — it suggests relative value for investors considering longer horizons.
Stay On Top of Gold & Silver Prices
Get important market alerts sent straight to your inbox.
People Also Ask
Is silver a better investment than gold right now?
At a 61.7 ratio, silver appears modestly undervalued relative to gold and tends to offer higher upside in a bull market. Gold is more liquid and less volatile and serves as a better reserve asset. For most investors, a combination works best: gold as a core monetary anchor and silver as a higher-beta complement.
How much silver should I own in my portfolio?
Advisors who include precious metals often recommend 5–15% of portfolio value in metals, with silver making up 2–5% of total assets as a common starting point. Allocation should reflect your time horizon: the structural case for silver plays out over years, not months.
What is the difference between physical silver and a silver ETF?
Physical silver (bars and coins) carries no counterparty risk and represents outright ownership, but requires storage and insurance. An ETF provides price exposure without the logistics, trades like a stock, and may involve fees and counterparty exposure. Fully allocated physical trusts are the closest paper proxies to owning physical metal.
What does COMEX silver inventory tell investors?
COMEX reports registered inventory (metal available for delivery against futures) and eligible inventory (metal held in vaults but not committed). A sustained decline in registered inventory signals physical delivery demand is outstripping supply and often precedes premiums for physical metal over paper and higher lease rates.
What happens to silver when the US dollar weakens?
Silver and the US dollar typically move inversely. A weaker dollar makes dollar-priced silver cheaper for foreign buyers and often reflects conditions that benefit silver — compressed real yields, higher fiscal deficits, and less confidence in monetary policy. Over 12–36 months, dollar weakness has historically supported higher silver prices.
What Should Silver Investors Watch Through the Rest of June 2026?
Three signals to monitor closely:
- June 17 — Warsh’s press conference: the median dot and his language on energy inflation will determine whether real yields compress or stay elevated.
- Ceasefire durability: each day the ceasefire holds reduces inflationary risk premium; watch crude oil moves below $85/bbl as a meaningful signal.
- Physical inventory data: track LBMA vault reporting and COMEX registered inventory; sustained declines and rising lease rates indicate physical tightness that can override policy statements.
SOURCES
1. LBMA — Silver & Gold spot prices and forecast data.
2. Silver Institute — World Silver Survey 2026.
3. Metals Focus — precious metals research.
4. J.P. Morgan Global Research — commodities outlook 2026.
5. Bureau of Labor Statistics — Consumer Price Index (May 2026).
6. CME Group — FedWatch tool and futures margin changes (February 2026).
7. Federal Reserve — FOMC materials and Warsh appointment (May 2026).
8. U.S. Senate — confirmation record (May 13, 2026).
9. Reuters — economic polling and analyst surveys (June 2026).
10. Goldman Sachs Global Investment Research — precious metals outlook 2026.
11. BlackRock — review of gold and silver volatility (2026).
12. Contemporary reporting on the 2026 US–Iran conflict and its market effects.
Disclaimer: This article is informational only and does not constitute financial or investment advice. Consult a qualified financial adviser before making investment decisions.
You may also like:
- Wall Street’s $6,000 gold call rests on data most investors never see
- Silver Eagle vs. Maple Leaf vs. Britannia: Which Gives You More Silver?
- Gold Price Outlook June 2026: What CPI and the Fed Mean
- How Gold Price Is Set: The East–West Tide Explained
- Does Physical Gold Have Counterparty Risk? The Facts
- Why Is Gold Still a Safe Haven? Switzerland’s Biggest Refiner Just Answered.
- Rate Hike Odds Just Hit 85%. Gold Is Up. Here’s Why.
- Gold Confiscation: Could the Government Take Your Gold Again?
- Gold Price History: From $35 to $4,500 in 100 Years
Popular Topics
Picked from the archive
-
01
 Topics
What the Fed’s 3-Day Silence Means for Gold Prices
-
02
Topics
Gold Jumps to $4,746 as Oil Crashes: Why Investors Are Bullish
-
03
Topics
How Government Debt Drives Gold and Silver Prices
-
04
Topics
Can Gold Hold at $4,300? Price Outlook for Investors
-
05
Topics
Why Gold and Oil Move Opposite and What It Means for Investors
-
06
Topics
Gold and Silver Prices: Short-Term Volatility, Long-Term Trend
-
07
Topics
Wholesale Prices Jump Most in 3 Years as Tariffs Hurt US Economy
-
08
Topics
Why Silver Jumped 6% Before Trump Xi Summit