Gold Drops 9%: CPI Report Could Extend or Reverse the Slide
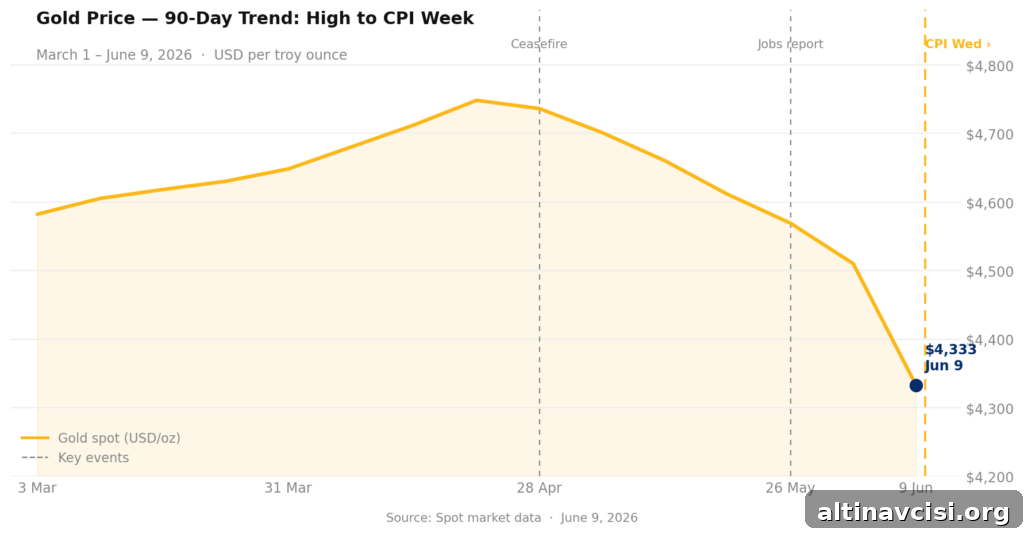
Gold is trading around $4,329 this Tuesday afternoon, roughly 9% below its late‑April peak. One key data point — the May Consumer Price Index (CPI), due at 8:30 AM ET on Wednesday — could move the market meaningfully in either direction.
Key Takeaways
- Why is gold falling in June 2026? Gold has retraced about 9% from its late‑April high near $4,800. Two main forces drove the decline: a partial Iran–Israel ceasefire removed a substantial geopolitical risk premium, and a stronger‑than‑expected May jobs report (172,000 versus an 85,000 consensus) led markets to price a higher probability of Fed rate hikes by year‑end.
- What does the May CPI report mean for gold? May CPI prints Wednesday at 8:30 AM ET. Consensus calls for headline CPI around +4.2% year‑over‑year and core CPI +0.3% month‑over‑month. A hotter‑than‑expected core reading would likely push gold toward the $4,280–$4,300 support area in the near term. A softer or in‑line print would likely stabilize prices and could trigger a rebound toward $4,400–$4,450.
- Is the pullback a structural reversal? No. The pullback reflects rising short‑term real yield expectations rather than a fundamental reversal of the long‑term case for gold. The current move looks like mid‑cycle consolidation rather than a shift away from the monetary and fiscal forces that supported gold’s multi‑year advance.
- What is the fiscal constraint argument? With roughly $39 trillion in federal debt, aggressive Fed tightening would sharply raise debt service costs. That fiscal constraint limits the central bank’s ability to fight inflation conventionally, which supports the long‑term case for gold across a 3–5 year horizon regardless of short‑term CPI outcomes.
Note: the number discussed above refers to the May CPI print timing and its potential impact on gold — not a forecast of gold’s future peak or trough.
What’s Happening to Gold Right Now?
Since late April, gold has entered a consolidation phase. Spot prices briefly reached the mid‑to‑upper $4,700s on April 20, but by June 9 the metal was trading near $4,329 — its lowest level since late March. Two developments over about a week explain most of the move.
First, an announced conditional halt between Iran and Israel removed much of the geopolitical premium that had supported prices through April. Risk premia often unwind quickly; when they do, they can trigger abrupt repricing in markets like gold.
Second, and more immediately relevant for the upcoming CPI print, the May jobs report surprised to the upside. Nonfarm payrolls rose 172,000 versus an 85,000 consensus and the unemployment rate remained at 4.3%. The bond market quickly repriced, and the probability of at least one quarter‑point Fed hike before December climbed sharply.
On tools such as the CME FedWatch, the chance of a December hike moved from roughly 14% five weeks ago to about 68–70% after the jobs release. That change in rate‑expectation is the primary mechanism behind gold’s pullback: rising expected real yields increase the opportunity cost of holding a non‑yielding asset.
Why Does a Rate Hike Threat Push Gold Down?
Gold does not pay interest. When bond yields rise or markets expect them to rise, the opportunity cost of holding gold increases. For investors weighing assets, a higher Treasury yield competes directly with a non‑yielding metal, prompting some marginal holders to trim positions.
Empirically, the 10‑year real yield (nominal Treasury yield less inflation expectations) is a strong near‑term predictor of gold price movements. Rising real yields generally pressure gold, while compressing real yields tend to support it. Currently, nominal yields are rising faster than inflation expectations, lifting real yields and contributing to gold’s retreat.
What the Rate‑Hike Story Is Missing
The simple narrative — “Fed might hike, gold is under pressure” — is accurate but incomplete. It overlooks the structural backdrop: persistent inflation drivers beyond energy, central bank behavior, and fiscal constraints. Recent small business data showed optimism below long‑term averages and a jump in uncertainty, suggesting cost pressures are broader than oil alone.
Core CPI is projected to be elevated, reflecting tariff pass‑through, wage pressures, and broader cost increases. In that environment the Fed faces a tradeoff: tightening to cool inflation versus the fiscal burden of higher interest costs on a large federal debt stock. If the Fed is constrained, conventional policy tools may be less effective, and gold can remain a favorable store of value over longer horizons.
What a Hot CPI Print Actually Means for Gold
For physical holders, the near‑term outcomes fall into two practical scenarios:
Scenario A — CPI Prints Hot
Headline above consensus: Bond yields would likely spike, and the market could push the probability of a December Fed hike past 70%. Gold would probably test nearby support in the $4,280–$4,300 range in the short term. This is the path the market appears positioned for now. Importantly, central banks and long‑term buyers often see these pullbacks as buying opportunities rather than permanent sell signals.
Scenario B — CPI Prints Inline or Softer
At or below consensus: The rate‑hike narrative would lose momentum. Real yields could stabilize or compress, allowing gold to hold current levels or rebound toward $4,400–$4,450. That outcome would better align with the longer‑term structural case for precious metals.
Either scenario leaves the longer‑term structural thesis intact. Gold’s multi‑year rise from roughly $1,200 in 2018 to near $5,600 in January 2026 was driven by central bank diversification, persistent inflationary pressures, and expanding global liquidity. A roughly 9% correction tied to short‑term repricing of Fed expectations looks like consolidation within that larger trend.
What the CPI Core Number Actually Tells You
The May CPI release at 8:30 AM ET on Wednesday is the first of a sequence of monthly data points that will shape market expectations for the remainder of the year. The number to watch is core CPI month‑over‑month; consensus is +0.3%. A print of +0.4% or higher would give the rate‑hike narrative new life and likely pressure gold in the immediate session.
The Federal Open Market Committee meets June 16–17 and is widely expected to pause. The critical market question becomes what happens between now and December: will core inflation reaccelerate or stabilize? This CPI print is the opening data point in that set. For long‑term physical holders, it alters entry points more than the fundamental rationale for owning gold over a 3–5 year horizon.
Stay On Top of Gold & Silver Prices
Receive timely market alerts and updates by email.
SOURCES
1. LBMA — Precious Metal Prices & Historical Data
2. Bureau of Labor Statistics — The Employment Situation, May 2026
3. CME Group — FedWatch Tool, 30‑Day Federal Fund Futures
4. Various market CPI forecasts and commentary (May 2026)
5. NFIB — Small Business Optimism Index, May 2026
6. Joint Economic Committee — Monthly Debt Update, June 2026
7. World Gold Council — Central Bank Gold Statistics, April 2026
8. Major media and market data providers reporting on May jobs and CPI (June 2026)
Disclaimer: This article is for informational purposes only and does not constitute financial or investment advice. Consult a qualified financial adviser before making investment decisions.
You May Also Like:
- Gold Price News: Goldman, China, CPI, and the Fed Explained
- Gold Near $4,330 as Rate‑Hike Bets Rise and China Acts
- Gold Is Down ~22% — Why the Downturn Differs From 2022
- Silver Falls on Jobs Beat: What It Means for the Market
- Rate‑Hike Fears and Gold: The Full Picture
- Central Banks Reshape Gold Markets
- Gold and NFP: The Decision Map After Payrolls
- Gold Surges on Macro Data: What Trapped the Fed
- Gold at $4,454: Why Some Say the Fed Is Trapped
- Central Banks Favoring Gold Over Treasuries — Implications
Popular Topics
Picked from the archive
-
01
 Topics
Gold Price Hits $5,000: Could the Rally Continue?
-
02
Topics
How Quantitative Easing Affects Gold, Silver and Industrial Metals
-
03
Topics
JPMorgan Predicts $6,300 Gold Price After Historic Crash
-
04
Topics
Gold vs Inflation: What 100 Years of Data Reveals
-
05
Topics
How to Dollar-Cost Average into Gold and Silver
-
06
Topics
Why Gold Soared 40% This Year After Moody’s Downgrade
-
07
Topics
China’s Biggest Gold Buy Since 2023 as Prices Fall 16%
-
08
Topics
Why Gold Prices Are Falling Despite Global Turmoil