Gold Drops 22% Like 2022: Why the Floor Is Different
Key Takeaways
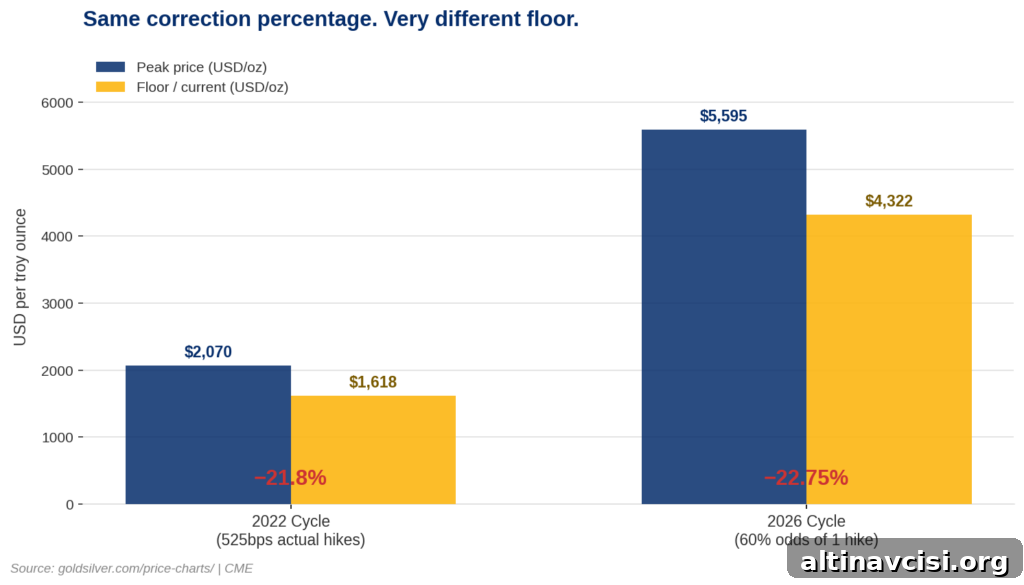
- Gold has declined roughly 22% from its January 2026 record high of $5,589 — a drop equivalent in magnitude to the entire 2022 Fed hiking cycle (525 basis points), but driven by very different forces.
- Central banks remain significant buyers: estimated purchases totaled 244 tonnes in Q1 2026, the largest first-quarter total on record according to central-bank and market estimates. Sovereign buying does not react to monthly jobs prints.
- Two short-term catalysts to watch are May CPI (June 10) and the first FOMC meeting under Chair Kevin Warsh (June 16–17). Neither event alters the deeper structural floor created by long-term sovereign demand.
The last time gold fell this quickly, the Federal Reserve raised rates by 525 basis points over 16 months. Today, markets are pricing only a roughly 43–50% chance of a single 25-basis-point hike before the end of the year — and that move has not even been taken. Yet the percentage pullback in gold from its peak is nearly the same. The drivers and the support beneath the market are very different now. Here’s what matters and why.
Why Is Gold “Supposed” to Be Lower Right Now?
The conventional relationship is simple: higher interest rates tend to pressure gold. Non-yielding assets are less attractive when bonds and savings deliver positive real returns. The arithmetic is straightforward.
At present the effective Fed funds rate sits at 3.50–3.75% after the April 29 decision. Market-implied odds of an additional 25-basis-point hike this year have risen to the mid‑40s percentile range. The 10-year TIPS (the real-yield benchmark many gold traders follow) remains positive, and the U.S. dollar strengthened after a stronger-than-expected May jobs report (172,000 payrolls versus an 85,000 forecast). Each of these elements is a textbook headwind for gold in the short term.
Compare that with 2022: the Fed raised rates by 525 basis points over 16 months and gold fell from about $2,070 to $1,618 — roughly a 22% decline. Today gold is down about 22% from its all-time high of $5,589 (set on January 28, 2026). But the present decline is driven largely by fear of a possible single hike rather than by an actual, sustained tightening cycle. Same percentage move; very different underlying dynamics.
The Edge Every Investor NeedsSmarter precious metals investing starts here. Sign up for concise market updates, Fed coverage, and timely analysis to help inform your decisions.
Why Hasn’t Gold Followed the Real‑Yields Playbook?
The traditional model — where ETF flows and Western retail/institutional investors dominate gold pricing — worked consistently from roughly 2010 to 2021. In that regime, rising real yields prompted selling and falling real yields encouraged buying, producing a tight correlation between real yields and gold prices.
That dynamic shifted in 2022 after Russia’s invasion of Ukraine and the freezing of large dollar reserves. Emerging-market and many other central banks saw a clear geopolitical risk in holding foreign reserves denominated in dollar assets. The result has been a significant policy-driven diversification away from U.S. Treasuries into gold. Central bank buying since 2022 has been a structural, mandate-driven change rather than a short-term trade based on yield trends.
That policy motive explains why gold can be down 22% on fear of a possible Fed move rather than on an actual multi-hundred-basis-point tightening. Sovereign reserve demand operates on a different timetable and for different reasons than ETF and hedge-fund flows.
What Is Actually Keeping Gold Above $4,300?
The clearest support under the market comes from sovereign demand. Central banks bought aggressively in recent years: more than 1,000 tonnes in each of 2022–2024, with a moderation in 2025 to 863 tonnes — still well above pre‑2022 averages. Estimates show central bank purchases surged again in Q1 2026 to 244 tonnes, the largest Q1 on record.
Individual country moves underscore the point. Poland has publicly targeted a reserve level of about 700 tonnes and continued adding to its holdings; the National Bank of Poland increased gold reserves and has made national-security arguments for further accumulation. The Bank of Korea also announced renewed gold-related allocations in Q1 2026, including allocations to overseas gold ETFs, marking a change in its reserve strategy.
These buyers are price‑insensitive in the conventional sense: they follow mandates and policy objectives rather than reacting to a monthly payrolls release. Whether gold trades down 22% or 5%, planned reserve accumulation continues until stated targets are met. That persistent sovereign demand establishes a significantly different structural floor than was present in earlier cycles driven primarily by ETF flows.
Is Gold Down 22% for the Same Reason as 2022?
In part, yes, but with an important distinction. In 2022 the Fed’s 525 basis points of actual tightening produced a clear bottom near $1,618. Today, gold is testing support in the $4,300–$4,340 area amid only modest market odds of an additional hike. The support is rooted in sovereign reserve accumulation rather than in the aftermath of a sustained, aggressive tightening cycle.
Technically, gold has been oscillating between its 200‑day moving average (near the lower support band) and its 50‑day moving average (around higher levels). Short‑term volatility and rate‑hike concerns limit sentiment, but the structural narrative — long-term central bank demand and portfolio diversification away from some dollar assets — remains intact and is cited by large institutions as the basis for higher longer‑term price targets.
What Do May CPI and the Warsh FOMC Meeting Mean for Gold?
Two near-term events merit attention. First, the May Consumer Price Index (due June 10) will influence rate‑watchers. A hotter-than-expected print would likely lift odds of a Fed hike and could push spot gold toward lower short‑term support near the $4,250–$4,270 range. A softer inflation reading or signs that energy‑related price pressures are easing could allow gold to rebound toward $4,500.
Second, the Federal Open Market Committee meeting on June 16–17 will be the first under Chair Kevin Warsh. That meeting will test how the new chair balances inflation concerns, financial stability, and political pressure. Market reactions to his policy signals can move prices in the near term, but they do not remove the deeper structural buyers in the market.
Put simply: short-term macro prints and central-bank leadership matter for sentiment, but they do not erase mandate-driven sovereign demand. Investors who hold physical gold retain a fixed share of global supply while sovereign institutions continue to compete for additional allocations. That dual reality helps explain both the volatility and the underlying support.
SOURCES
1. CME Group — FedWatch Tool
2. U.S. Department of the Treasury — Daily Treasury Real Yield Curve Rates
3. U.S. Bureau of Labor Statistics — May 2026 Employment Situation Summary
4. CBS News — Highest Gold Price in History coverage
5. World Gold Council — Central Bank Gold Statistics and commentary
6. World Gold Council / Metals Focus — Gold Demand Trends Q1 2026
7. JPMorgan and institutional research notes on gold outlooks and technicals
8. Major financial news outlets reporting on market reactions and Fed decisions
Disclaimer: This article is for informational purposes only and does not constitute financial or investment advice. Always consult a qualified financial adviser before making investment decisions.
You May Also Like:
- Silver Falls 6% on Jobs Beat — The Six‑Year Deficit Didn’t
- Gold Rate‑Hike Fears Are Weighing on Prices — Here’s the Full Picture
- Gold at $4,480: Physical Demand Hits a 50‑Year Milestone
- Gold Holds $4,481 With Rate‑Hike Risk Rising — The NFP Decision Map
- Gold Surges 1.5%: ADP, ISM, and Beige Book Trap the Fed
- Gold at $4,454 Says the Fed Is Trapped — Here’s Why
- Central Banks Picked Gold Over Treasuries — Should You?
- Central Banks Just Crossed a Line Not Seen Since 1996
- Factory Costs Hit 82.1 — That Number Is Now Working for Your Gold
- Gold at $4,500: What Fort Knox, China, and Silver Are Telling You
- Silver Has Two Engines — Stagflation Is the One Condition That Fires Both
Popular Topics
Picked from the archive
-
01
 Topics
Gold Hits $4,000: Why the Debasement Trade Isn’t Dead
-
02
Topics
Elon Musk Sparks Silver Demand Boom for Green Tech
-
03
Topics
Silver Prices Eye Record Highs as Fed Signals Rate Cuts
-
04
Topics
Gold Price Nears $4,000 as U.S. Data Confidence Falters
-
05
Topics
Gold Prices: 5 Forces Investors Are Watching Now
-
06
Topics
How Kevin Warsh as Fed Chair Could Affect Gold Prices
-
07
Topics
Updated 2026 Gold Price Outlook After Q1
-
08
Topics
Why Gold Prices Are Falling Despite Global Turmoil