How Gold Prices and Nonfarm Payrolls Trap the Fed
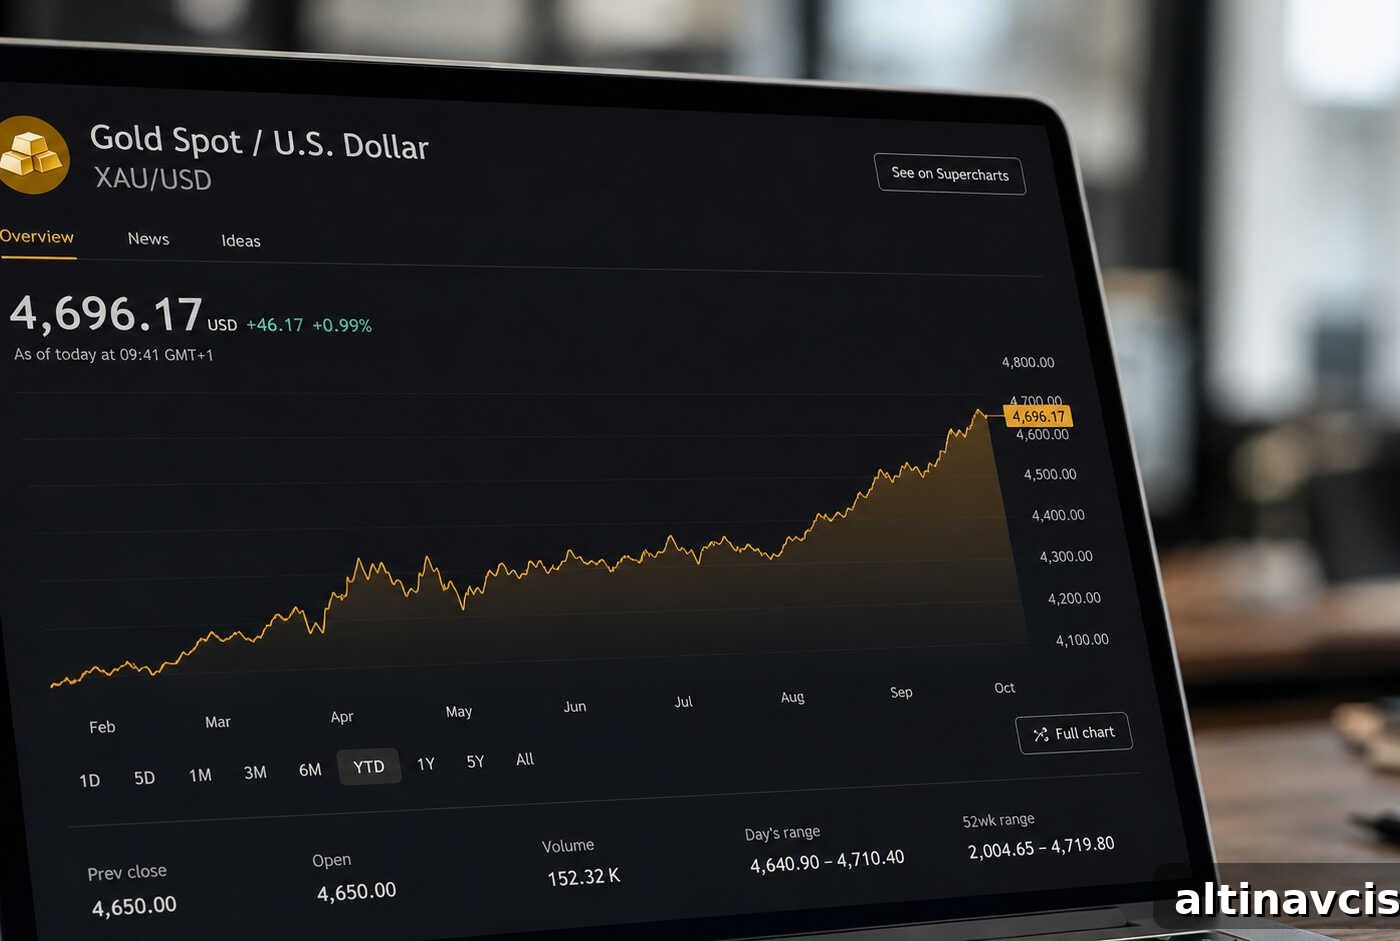
Gold and silver market update — May 7, 2026
Key Takeaways
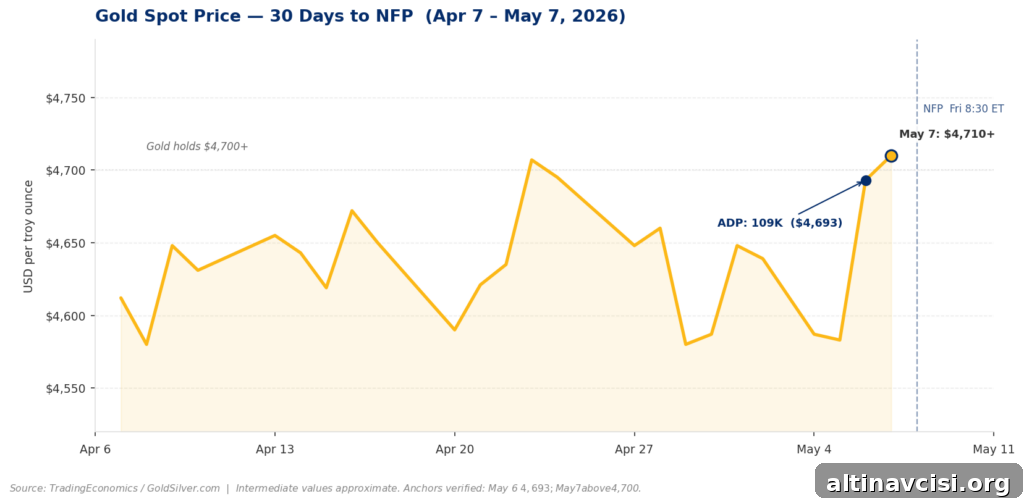
- ADP’s April private payrolls showed +109,000 jobs — above the Dow Jones/CNBC consensus (84,000) but below some broader forecasts. Despite the mixed surprise, gold remained firm above $4,700 and continued to push higher.
- The Federal Reserve faces a policy dilemma: services inflation sits at multi-year highs while interest payments on the national debt exceed $1 trillion annually. That restricts the Fed’s ability to change course decisively.
- On Friday, focus on average hourly earnings rather than headline payrolls. Rising wages alongside slower hiring would reinforce a stagflation scenario and strengthen the case for precious metals.
ADP’s May 6 release reported 109,000 private-sector jobs added in April and annual pay for job stayers up 4.4%. Depending on the benchmark, this read can be framed as either a modest beat or a miss. The more notable market reaction was the lack of one: gold barely budged and continued to trade near and above $4,700, while silver also moved higher. When a metal fails to respond to data that historically shifts prices, the market is signaling a deeper trend.
Below is a concise look at why that deeper trend matters, what to watch in the coming NFP release, and how investors in gold and silver should position themselves.
What Did the April 2026 ADP Report Actually Show?
The ADP National Employment Report showed private payrolls rising by 109,000 in April, with annual pay for job stayers increasing by 4.4%. Benchmarks varied: some outlets expected 84,000 while others projected as many as 120,000. The mixed set of expectations explains why different observers labeled the print either a beat or a miss.
Historically, stronger private hiring tends to push investors toward tighter-rate expectations, which can weigh on gold. But in this instance metals barely reacted. Gold remained anchored above $4,690 on May 6 and climbed above $4,700 the following day; silver also advanced past $77. That muted response is the market’s clue: short-term data are losing influence relative to longer-term structural forces.
Why Isn’t a Strong Jobs Report Bearish for Gold Right Now?
The Federal Reserve’s policy path is increasingly constrained by inflation dynamics and fiscal realities, rather than by employment alone. CME FedWatch pricing shows an overwhelming market probability that the Fed will hold the federal funds rate at 3.50%–3.75% at its June meeting. That expectation reflects persistent inflationary pressure, particularly in services.
The ISM Services Prices Paid index was 70.7 in April, the same level as March and the highest reading since October 2022. That indicates elevated input costs across industries and suggests inflation pressures will persist even if near-term geopolitical shocks ease. At the same time, the U.S. now carries an annual interest bill measured in the high hundreds of billions to over $1 trillion, according to recent budget outlooks. That debt-service burden limits the Fed’s flexibility: cutting risks faster inflation, while hiking increases the strain of interest costs.
Put simply, strong jobs data alone are unlikely to force a decisive pivot away from the current gold-supportive backdrop.
What Does Friday’s Nonfarm Payrolls Report Mean for the Gold Price?
The Bureau of Labor Statistics releases the April nonfarm payrolls (NFP) figure at 8:30 AM ET on Friday. Consensus estimates center well below March’s 178,000 print, with various forecasts ranging roughly between 55,000 and 75,000.
Three practical scenarios:
- Below ~55,000 — stagflation confirmed: If hiring weakens while wages and services inflation remain elevated, the Fed will be stuck between curbing inflation and accommodating debt service. That stalemate favors gold and could see silver outperform due to its industrial exposure.
- 55,000–75,000 — in-line outcome: A middle-of-the-road reading would probably produce modest price moves but leave the long-term structural case for precious metals intact.
- Above ~100,000 — hawkish reprieve: A notably strong employment surprise would revive expectations of higher-for-longer policy, pushing rate-cut timelines out and likely prompting a short-term retracement in gold of 1–2% or more.
Why Did Gold Ignore a Stronger-Than-Expected ADP Report?
A growing structural bid underpins the gold market. Central bank purchases and sustained demand from investors and institutions have added a significant longer-duration support that single economic releases increasingly fail to unsettle. For example, central banks continued net purchases of gold in Q1 2026, reinforcing a base of demand that does not flip on a single midweek payroll print.
When a typical market driver stops moving a price, it suggests the market is focused on broader fundamentals rather than transient headlines.
What Should Gold and Silver Investors Actually Watch on Friday?
Rather than fixating on the headline NFP number, investors should watch average hourly earnings and detailed wage metrics. Elevated or accelerating wages amid slowing hiring would intensify the stagflation argument and lend significant support to gold and silver. Also pay attention to continuing jobless claims; a rise in continuing claims alongside low initial claims can indicate a labor market where finding new work is getting harder, an important but quieter signal of labor stress.
Short-term volatility from the NFP release is likely, but these underlying indicators will matter more for the persisting trend in precious metals.
Stay On Top of Gold & Silver Prices
Get timely market alerts and analysis delivered to your inbox.
SOURCES
1. ADP Research Institute — ADP National Employment Report: Private Sector Employment Increased by 109,000 Jobs in April; Annual Pay was Up 4.4%
2. CNBC — Private payrolls rose by 109,000 in April, topping expectations, ADP says
3. CME Group — FedWatch Tool: Federal Funds Rate Probabilities
4. Institute for Supply Management — ISM Services PMI report, April 2026
5. TradingEconomics — Gold Spot Price, May 6, 2026
6. TradingEconomics — Silver Spot Price, May 6, 2026
7. World Gold Council — Gold Demand Trends Q1 2026
8. Bureau of Labor Statistics — Employment Situation, March 2026
9. Congressional Budget Office — The Budget and Economic Outlook: 2026 to 2036
10. Federal Reserve Bank of St. Louis (FRED) — Initial Claims data, week ending April 25, 2026
Disclaimer: This article is for informational purposes only and does not constitute financial or investment advice. Always consult a qualified financial adviser before making investment decisions.
You May Also Like:
- Gold Is Decoupling From Geopolitics. Here’s the Proof
- The Fed Is Frozen. The Debt Is Growing. Gold Is Watching.
- Gold Jumps on Iran Deal Hopes. The Real Driver Is the Fed
- What the IMF’s Inflation Forecast Shift Means for Gold
- What’s Really Driving Gold Prices Today — 5 Key Signals
- Gold Price and the Jobs Report: A Pre-Market Guide
- The Gold-Silver Ratio Is Expanding — and Being Misread
- Gold, Silver, and Stagflation: 5 Signals That Matter Now
Popular Topics
Picked from the archive
-
01
 Topics
Why Metals Led Markets in 2025 and What It Means for 2026
-
02
Topics
Wall Street Whiplash: Stocks Rally on CPI, Plunge on PPI Shock
-
03
Topics
US Treasury Yields Rise Ahead of Major Bond Auction
-
04
Topics
Markets Slash ECB Rate-Cut Odds After Trade Deal Eases Tariff Fears
-
05
Topics
3 Questions Investors Must Ask Before Buying Any Asset in 2026
-
06
Topics
Gold vs Cash: How Inflation Destroys Dollar Purchasing Power
-
07
Topics
U.S. Gas Prices Fall to 12-Month Low Despite Heat; Storage Up 6%
-
08
Topics
Gold Price 3,767 USD: Fed Rift Deepens as China Eyes Share