Why Gold Is Decoupling From Geopolitics (New Evidence)
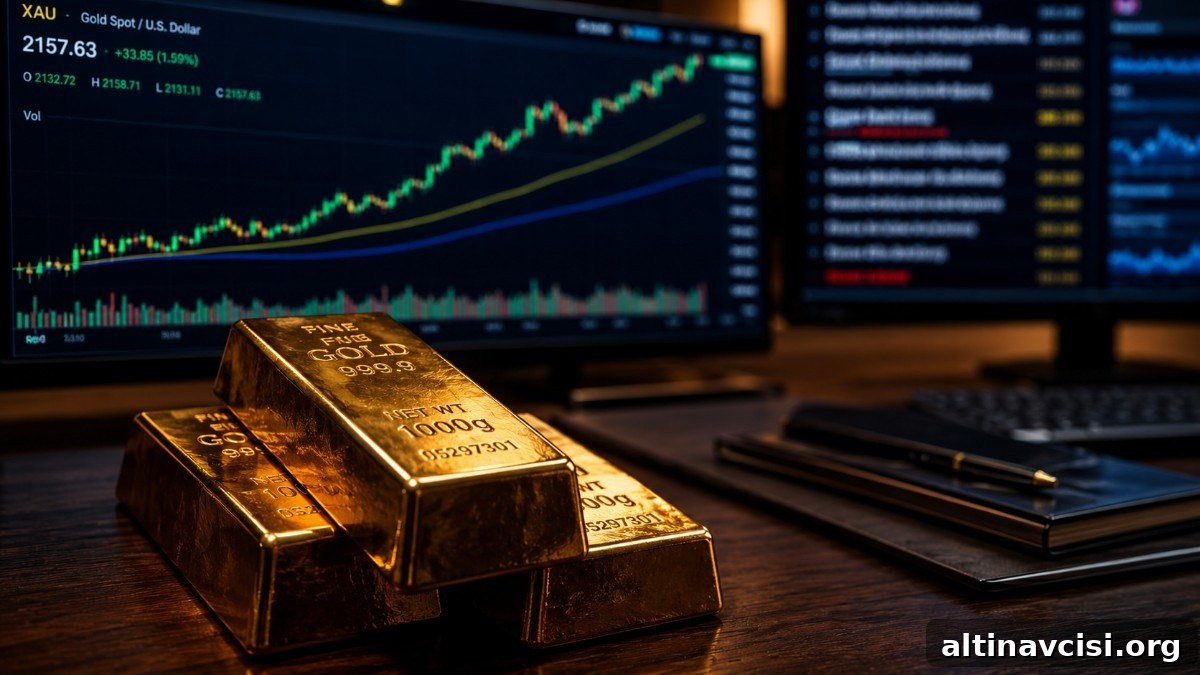
Gold and silver market update — May 6, 2026
Key Takeaways:
- Gold is holding near $4,700 despite fresh reports that US Central Command briefed President Trump on options regarding Iran — a catalyst that pushed gold sharply lower in March. The muted market reaction is itself meaningful.
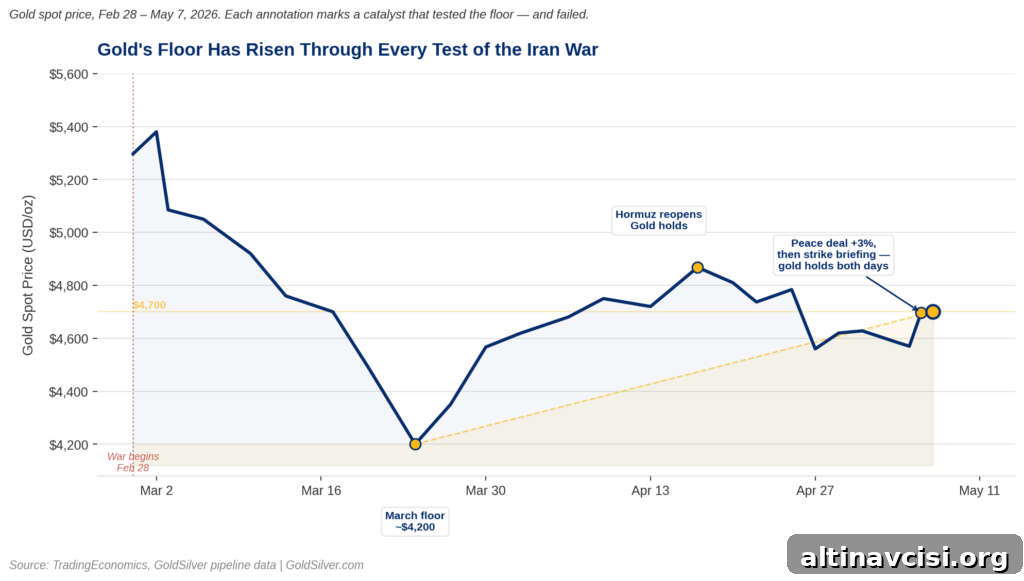
- The intraday lows that defined gold’s March floor around $4,130–$4,200 have given way to a new, higher floor near $4,700. That resilience has been driven by monetary forces — fiscal pressure, sustained central bank buying, and a weaker dollar — rather than by geopolitical developments alone.
- The next major price drivers are likely political and monetary: the Senate vote on Kevin Warsh (expected the week of May 11) and the June 16–17 FOMC meeting, where updated dot-plot projections will clarify whether a path to rate cuts opens or remains closed.
Gold is trading near $4,700 on May 6, 2026, showing signs of decoupling from headline geopolitics. It kept the gains from a 3% rally earlier in the week tied to hopes for a Middle East peace deal, even after reports that US military commanders briefed the president on potential strike options in Iran. Brent crude also recovered to roughly $101–$102 per barrel after an earlier drop.
When a market no longer collapses on the same catalyst that broke it previously, the market structure has changed.
Why Is Gold Not Falling on Iran Escalation News?
In March, each fresh sign of escalation in the Iran conflict pushed gold lower. That reaction was less about conflict itself and more about the economic consequences: oil spikes that kept inflation elevated and discouraged the Federal Reserve from cutting rates. With rates high or expected to stay high, non-yielding assets like gold lose some appeal.
That dynamic still exists: CME FedWatch showed a high probability (about 94.9%) that rates would be unchanged in June. But three important shifts since March help explain why gold is stable near $4,700 today.
Why Has the Gold Price Floor Risen Since March?
The floor moved up and stayed there. Gold closed the week ending March 20 at $4,491 — its weakest weekly showing since 1983 — and logged intraday lows around $4,130–$4,200. Since that trough, the market has absorbed repeated reversals: ceasefire announcements, tanker strikes, and military briefings, yet each time the price held above the lower boundary. The buying interest is deeper now than the headlines are loud.
Monetary forces have strengthened independently of the war. At the April FOMC, the Fed’s leadership framework evolved as Jerome Powell confirmed he will remain on the Board of Governors even if Kevin Warsh becomes Chair. Warsh’s nomination cleared the Senate Banking Committee by a 13–11 vote on April 29, and a full Senate vote was expected the week of May 11. Warsh is likely to preside over the June 16–17 FOMC meeting, the first to include an updated dot plot. Markets have modestly lifted the odds of a year‑end rate hike after that meeting.
These are not Iran-driven developments. They reflect an institutional shift—effectively fiscal dominance and a more cautious rate-cut outlook—which bolsters gold’s bid regardless of diplomatic progress in Tehran.
Gold is also shrugging off data that would normally be bearish. ADP reported 109,000 private payrolls in April, well above the Dow Jones consensus and the strongest reading since January 2025. Typically, stronger labor data reduces the chance of Fed cuts and weighs on gold. Yet the metal barely reacted, indicating a structural demand base that is less sensitive to single data points than before.
What Does It Mean That Gold Has Decoupled from Geopolitical News?
A close look at one trading day makes the point clear. In the morning, hopes for a peace deal pushed oil lower, easing inflation concerns and opening the possibility of Fed rate cuts — gold jumped about 3%. Hours later, a military briefing was reported, oil rebounded, and the case for an unchanged Fed remained intact — yet gold held most of its gains. Two opposing signals, same metal, one day.
That sequence suggests the geopolitical premium and the peace premium are smaller than the new structural monetary support under gold. That support rests on several compounding factors: rising annual US interest obligations, near-record central bank gold purchases, and a notably weaker dollar over the past year. These are multi-quarter trends that don’t flip with a single headline.
Where the market can still change materially is at the top — the ceiling. The ceiling is driven by rate-expectation shifts, and the June 16–17 FOMC meeting will be decisive. Friday’s nonfarm payrolls report (consensus range roughly 55,000–62,000, down from 178,000 in March) will be the clearest preview: a weak print gives new Fed leadership room to signal easing, while a strong print keeps rate-cut expectations muted.
The Iran conflict repeatedly tested the new price floor over many weeks, and each time the floor held. That resilience is not random; it reflects arithmetic tied to monetary and fiscal realities.
Stay on Top of Gold & Silver Prices
Receive timely market alerts and essential updates directly to your inbox.
Sign up on the site to get short, focused market notes, Fed watchers’ updates, and price alerts for gold and silver.
SOURCES
1. TradingEconomics — Gold Spot Price, May 6, 2026
2. TradingEconomics — Brent Crude Oil Spot Price, May 6, 2026
3. Axios — Report on military briefing to President Trump regarding Iran options
4. CNBC — Coverage of gold’s move on weaker dollar and Middle East peace hopes
5. CNBC — ADP private payrolls report for April 2026
6. CME Group — FedWatch Tool: June 2026 rate probabilities
7. Federal Reserve — FOMC statement, April 29, 2026
8. Contemporary reporting on gold’s March rout and historical weekly performance
9. Congressional Budget Office — Budget and economic outlook commentary
Disclaimer: This article is informational only and does not constitute financial, investment, or trading advice. Consult a qualified financial adviser before making investment decisions.
You May Also Like:
- The Fed Is Frozen. The Debt Is Growing. Gold Is Watching.
- Gold Jumps on Iran Deal Hopes. The Real Driver Is the Fed
- What the IMF’s Inflation Forecast Shift Means for Gold
- What’s Really Driving Gold Prices Today — 5 Key Signals
- Gold Price and the Jobs Report: A Pre‑Market Guide
- The Gold‑Silver Ratio Is Expanding — and Being Misread
- Gold, Silver, and Stagflation: 5 Signals That Matter Now
- Why Gold Fell on the Hormuz Tanker Strike
Popular Topics
Picked from the archive
-
01
 Topics
Why Metals Led Markets in 2025 and What It Means for 2026
-
02
Topics
Wall Street Whiplash: Stocks Rally on CPI, Plunge on PPI Shock
-
03
Topics
US Treasury Yields Rise Ahead of Major Bond Auction
-
04
Topics
Markets Slash ECB Rate-Cut Odds After Trade Deal Eases Tariff Fears
-
05
Topics
3 Questions Investors Must Ask Before Buying Any Asset in 2026
-
06
Topics
Gold vs Cash: How Inflation Destroys Dollar Purchasing Power
-
07
Topics
U.S. Gas Prices Fall to 12-Month Low Despite Heat; Storage Up 6%
-
08
Topics
Gold Price 3,767 USD: Fed Rift Deepens as China Eyes Share