Gold Safe-Haven Demand Returns After 9-Day Selloff
🌅 Morning News Nuggets | Today’s top stories for gold and silver investors
March 25th, 2026 | Brandon Sauerwein, Editor
Gold and silver rebounded sharply this morning, snapping a nine-day losing streak. With Iran talks in flux and oil swinging wildly, safe-haven demand for gold has resurfaced.
Gold Safe Haven Demand Returns After Nine-Day Selloff
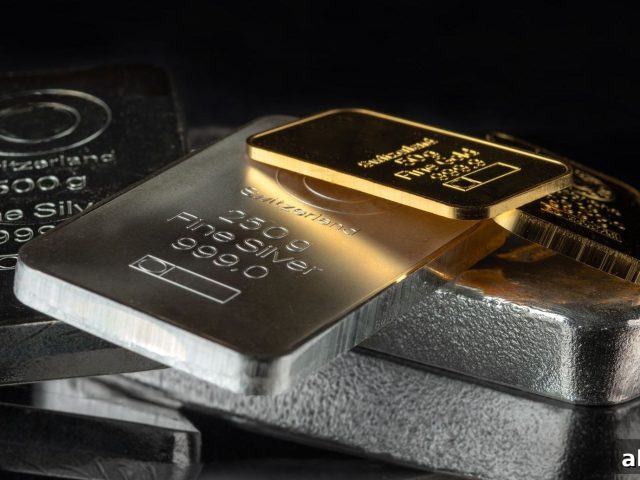
Gold steadied after its sharpest weekly drop since 2011. Spot prices climbed roughly 2% on Wednesday, recovering to about $4,568 per ounce, with futures trading back above $4,500.
Silver also bounced, with spot silver rising nearly 4% to about $74. After nine consecutive days of declines, buyers reentered both metals markets.
The pullback had been severe: gold fell roughly 21% from its January high near $5,594, moving into official bear-market territory. Despite the drop, several analysts remain constructive. UBS raised a target to $6,200; other houses and funds have year-end targets clustered around $6,000, while some longer-term forecasts remain significantly higher. The rapid dip and the subsequent buying tell you the market still has substantial interest in precious metals as a defensive allocation.
In short, the correction appears to be met with demand rather than capitulation.
Trump Claims Iran Talks “Ongoing” — Tehran Denies It. Markets Swing Wildly.
Diplomacy and conflict are now both clouded by uncertainty. President Trump said the U.S. and Iran are “in negotiations right now” and claimed a multi-point peace plan has been delivered through intermediaries. He even declared the war “won.”
Iran has publicly denied ongoing negotiations. A military spokesperson said talks are not taking place. Still, Tehran sent a letter to the International Maritime Organization indicating that “non-hostile” ships may transit the Strait of Hormuz with coordination—an effort to clarify commercial shipping protocols under current tensions.
Markets are reacting to the mixed signals. Oil fell more than 5% overnight on hopes for a ceasefire and briefly traded below $100 a barrel after spiking higher earlier. At the same time, attacks continue in the region: missiles struck Tel Aviv, drones impacted Kuwait’s airport, and the Pentagon has announced additional deployments. The result is a market oscillating between hope for de-escalation and preparations for further escalation.
That alternating dynamic—optimism versus risk—has been the dominant driver across asset classes and is the backdrop for the recent moves in gold and oil.
Gold vs. Oil: What the Ratio Is Signaling Now
Oil has risen sharply—roughly 50% since the Iran conflict escalated—one of the fastest moves in decades. Yet the gold-to-crude ratio remains unusually high.
Historically, the gold-to-crude ratio averages in the 15–20x range. Today it sits closer to 45–50x even after oil’s recent spike. That elevated reading suggests gold is significantly outperforming oil and signals persistent uncertainty rather than a pure commodity-driven inflation trade.
The April 2020 outlier—when oil briefly traded at negative prices—pushed the ratio above 140x and reflected a liquidity crisis. Today’s elevated ratio, by contrast, speaks to ongoing geopolitical uncertainty and a wider repricing of risk across markets.
Two conclusions follow. First, oil’s rapid rise has not fully matched gold’s momentum. Second, markets are discounting more than inflation alone; elevated ratios often indicate deeper worries about growth, policy direction, and financial stability. Historically, extreme readings tend to correct either by oil catching up or by gold easing. Given the stickiness of geopolitical premiums in gold, oil may be more vulnerable if the Strait of Hormuz reopens and supply concerns abate.
What we’re seeing is a rare combination: higher energy costs alongside persistent safe-haven demand for gold. This is not a straightforward inflation trade but a broader repricing of risk that is unlikely to reverse overnight.
How Much Has Oil Gone Up?
At the start of 2026, oil traded between $60 and $70 per barrel amid expectations of ample supply. Following the Iran conflict, Brent crude surged to about $120 at its peak—a roughly 50% increase—before easing back into the $95–$100 range. Even after some pullback, prices remain well above pre-conflict levels.
This pace of change is unusual. Markets do not need an actual physical disruption to move sharply—only the risk of one. The Strait of Hormuz handles roughly 20% of global oil flows, so even partial disruption or threats to transit can quickly lift prices. Because energy underpins transportation, manufacturing, and food costs, rapid oil spikes translate into inflationary pressure with a lag.
Could Oil Push Inflation Back to 4%?
Recent headline CPI readings suggested inflation had eased—figures were recorded around 2.6% for headline and roughly 2.7% for core—but those data points predate the recent oil move. Because energy flows through transportation, goods, and food, rising oil typically shows up in inflation measures with a delay. Economists are warning that CPI could move back toward 4% if energy prices remain elevated, reversing some of the recent disinflationary progress.
Energy is not the only concern: wage growth remains firm, supply-chain constraints persist in some sectors, and trade tensions can add to cost pressures. All of this complicates central-bank policy decisions. Policymakers may need to keep rates tighter for longer even as growth slows, and where policy and growth diverge, precious metals often regain investor attention as a hedge.
In short, markets may be underestimating upside inflation risk. If inflation reaccelerates, that dynamic often supports renewed strength in gold.
You May Also Like
- Gold Price Correction Settles as Saudi Arabia Eyes Iran War
- What’s Driving Gold’s Sharpest Pullback of the Year
- Gold Price Drop Today — War Rages as the Debt Hits $39 Trillion
- Gold Price Outlook: Fed Holds, PPI Climbs
- Gold Price Today Holds at $5,000 — What’s Driving It
- Gold Price Forecast 2026: Fed, Iran, and the $6,000 Question
Popular Topics
Picked from the archive
-
01
 Topics
Gold Price Drops Below $5K After Jobs Revisions Roil Markets
-
02
Topics
Fed Governor Resignation Strengthens Trump in Powell Rate Fight
-
03
Topics
Gold Falls to One-Week Low as Trade Talks Enter Final Days
-
04
Topics
Silver Surges Past $70 Amid Conflicting GDP Data
-
05
Topics
Harvard 51B Endowment Sells Tech, Buys Gold and Crypto
-
06
Topics
Gold Price Falls Below $3,340 Ahead of Fed Comments
-
07
Topics
Gold Trading Volume: Why $227B Daily Trades Matter to Investors
-
08
Topics
US Q2 GDP Rises as Falling Imports Mask Weak Domestic Demand