Can Silver Outpace Gold in a Bull Market?
Silver spent most of 2025 trailing gold — then, in a single stretch, it more than doubled. If you’ve wondered when silver tends to outperform gold, the answer is consistent: usually after gold has already done the heavy lifting. That pattern has repeated across the major precious metals bull markets of the past five decades.
Gold moves first. Silver waits. Then silver often outperforms.
Rather than being a coincidence, this sequence reflects the different roles the two metals play in the global financial system and investor behavior during crises and bull markets.
When Does Silver Outperform Gold? The Data Has a Clear Answer
Gold’s head start in many bull markets is structural. It functions primarily as a monetary and safe-haven asset: central banks hold it, institutions buy it when inflation rises, currencies weaken, or geopolitical risk spikes. Gold is the first precious metal to react when risk and uncertainty increase.
Silver occupies a hybrid role. It is both a monetary metal and an industrial commodity: a large share of demand comes from solar panels, electronics, and electric vehicles. That industrial exposure makes silver more sensitive to expectations for economic growth. During the early phase of a crisis, when fear dominates, silver’s industrial links can hold it back even as gold rallies.
There’s also an attention and capital-flow gap. Gold attracts headlines and serious institutional capital earlier; silver typically draws broader speculative and industrial buying later. The recurring pattern across multiple cycles is that gold leads, silver catches up, and often overshoots.
What Did Gold and Silver Do in the 1970s Bull Market?
The 1970s bull market provides a clear example of this dynamic. The cycle began in earnest after the U.S. ended dollar convertibility to gold in 1971, dismantling the Bretton Woods exchange-rate regime. Gold was then free to find a market price and rose quickly: by 1974 gold was roughly 240% above its 1971 level. Silver had also risen, but by a smaller margin — around 150% by 1974.
As inflation accelerated in the later 1970s and real interest rates turned deeply negative, silver’s move intensified. A confluence of macro pressure and speculative demand pushed silver dramatically higher toward the end of the decade, and it outpaced gold during the final leg of that run. Most of the relative gains for silver occurred in the last 12 months of the decade-long bull market.
Did Silver Outperform Gold in 2025?
You don’t need to go back decades to see the pattern in real time — the last 15 months offer a recent, clear example. Gold opened 2025 around $2,798 per ounce and silver near $31. Through the first eight months of the year, gold advanced strongly while silver lagged: by April gold was up roughly 17% while silver had gained about 4%.
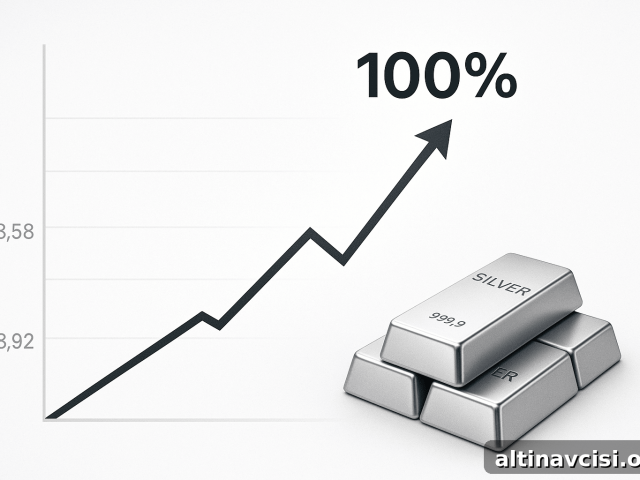
That changed in late 2025. Silver began closing the gap in September and then accelerated sharply. By November silver was up more than 80% from its January base while gold had gained about 51%. By December silver exceeded a 128% gain, and in January 2026 silver reached $113.95 per ounce — about a 264% increase in twelve months. Gold peaked the next month at $5,278, up roughly 88.6% for the same period.
In short, silver finished nearly three times stronger than gold over that 15-month window. By March 2026 both metals had pulled back somewhat — silver trading nearer $88 and gold around $5,000 — but the sequence matched the historic pattern: gold led, silver lagged, then silver surged.
The Gold-Silver Ratio: A Signal Worth Watching
The gold-silver ratio — how many ounces of silver it takes to buy one ounce of gold — is a useful gauge of where the market stands. Over the very long run, the ratio has averaged roughly 60:1. During bull markets, this ratio often compresses as silver outperforms.
Historically notable levels include a mid-cycle compression at the 1980 peak, when the ratio contracted sharply, and an April 2011 low in the low 30s before silver’s correction. Conversely, early 2020 saw the ratio spike near 120:1, which signaled silver was historically cheap relative to gold. With gold near $5,000 and silver closer to $80 in early 2026, the ratio sits near the long-term average — indicating that silver has already closed much of the historical gap in this cycle.
So What Does the Silver Lag Pattern Mean for Investors?
No two cycles are identical, but the logic behind the lag-and-outperform pattern is consistent: gold typically anchors the early phase of a precious-metals bull market because of institutional and central bank demand. Silver, with its smaller market size, industrial linkages, and higher volatility, tends to amplify gains later in the cycle.
The recent cycle reinforced that pattern: after years of silver lagging gold, silver delivered outsized gains once momentum shifted. Structural drivers also support silver’s case going forward — rising industrial demand from solar and electric-vehicle sectors, persistent supply constraints, and a growing investor base exposed to precious metals by central bank buying.
Precious metals are volatile and corrections are normal. For investors who study market cycles, the recurring pattern over decades — gold leads, silver follows, silver often outperforms — is a reliable framework for understanding how these markets tend to unfold.
People Also Ask
Why is silver not going up as fast as gold right now?
Silver often lags early because institutional and central bank demand focuses on gold first. As the bull market matures, broader investor interest and industrial demand can push silver higher, sometimes rapidly.
Does silver usually outperform gold in a bull market?
Historically, yes: in many precious-metals bull markets silver has outperformed gold during the later stages. Its smaller market capitalization and greater volatility allow larger percentage moves once capital shifts into silver.
What is the gold-silver ratio and why does it matter?
The ratio measures how many ounces of silver are needed to buy one ounce of gold. A high ratio indicates silver is relatively cheap; a falling ratio shows silver is outperforming. It helps investors gauge where they are in a precious-metals cycle.
Is silver undervalued compared to gold right now?
With the gold-silver ratio close to its long-term average in early 2026, silver has already closed some of the historical gap. However, late-cycle moves can compress the ratio further, leaving room for silver to outperform if momentum continues.
When does silver usually start outperforming gold?
Silver typically begins to outperform after gold has established a sustained uptrend — commonly in the mid-to-late stages of a bull market, when investor confidence grows and capital flows toward higher-volatility assets.
You May Also Like:
- Why Gold Could Hit $6,000: Recession & Geopolitical Tensions
- How Gold Performs in Recessions: Lessons from History
- Gold vs. Inflation: What a Century of Data Shows
- Why Silver Is More Volatile Than Gold — And Why It Matters
- Silver Bars vs. Silver Coins: Which Is the Better Investment?
The Financial System Isn’t Safer — And You Know It
As risks mount, see why gold and silver are projected to keep shining in 2026 and beyond.
Subscribe to receive concise market updates and alerts on precious metals.
Stay On Top of Gold & Silver Prices
Get important market alerts sent straight to your inbox.
Popular Topics
Picked from the archive
-
01
 Topics
How COMEX Sets Gold Prices and Moves Global Markets
-
02
Topics
UBS Warns Investors: USD Unattractive After 10% Annual Drop
-
03
Topics
Dollar Hits Multi-Year Low as $3.3T Trump Budget Spurs Debt Risk
-
04
Topics
Trump Targets Powell Over Fed Spending, White House Tensions Rise
-
05
Topics
How to Invest in Silver: A Practical Guide to Growing Wealth
-
06
Topics
Tariff Burden Shifts to Consumers, Could Push Inflation to 3.2%
-
07
Topics
Silver Could Double in 2025 as Dollar Dominance Fades
-
08
Topics
Market Update: Gold Steady, Shoppers Cautious, Nvidia Scrutinized