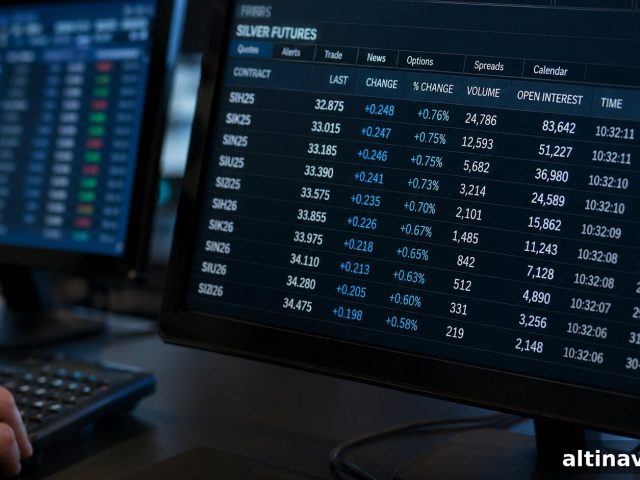
Silver Fair Value: Historical Trends and Market Data
Silver is trading near $73 per ounce — about 40% below its January 2026 nominal peak and far lower than most valuation measures imply it should be. The gold‑silver ratio is around 62:1, close to its modern long‑term average. Adjusted for CPI, the 1980 intraday high of $49.45 equates to roughly $170–$195 today. The Silver Institute forecasts a sixth consecutive annual supply deficit of 67 million ounces in 2026. Taken together, these fundamentals do not support the idea that silver is overvalued at current prices.
As of writing, silver trades near $73 per ounce — roughly 40% below the nominal all‑time high of $121.67 set on January 29, 2026. That pullback has surprised many market participants, both bullish and bearish. The more important question is whether current prices reflect silver’s fair value or whether the market is materially mispricing the metal relative to its historical and structural anchors.
This article examines the main valuation frameworks and what they imply for silver’s fair value.
What Does “Silver Fair Value” Actually Mean?
“Fair value” for silver is not a single fixed number. It is a range inferred from several valuation anchors: inflation‑adjusted historical peaks, the long‑run gold‑silver relationship, and the supply‑demand balance — particularly structural industrial demand versus mine and recycled supply. No single method gives a definitive answer on its own, but together they indicate whether silver is an opportunity, reasonably priced, or overvalued.
Silver behaves both as an industrial commodity and a monetary metal with millennia of use as a store of value. Any valuation that ignores its monetary role will miss an important component of price formation.

Your Gold Buying Guide Many investors overpay both when buying and selling precious metals. This concise guide explains what to own and why, in practical, easy‑to‑follow terms.
Downloadable guide available. Subscribe for updates and market insights.
Is Silver Cheap Relative to Its Own History?
The most commonly cited historical benchmark for silver is the January 1980 intraday high of $49.45, reached during an attempt to corner the market by the Hunt brothers. In nominal terms that remained the record until early 2026; in inflation‑adjusted terms it still stands as the real peak.
Adjusted for CPI inflation, that 1980 spike equates to roughly $170–$195 per ounce in today’s dollars, depending on the inflation series used. By contrast, the 2011 high of $48.70 adjusts to about $70 today — a level silver has already exceeded in the current cycle.
At roughly $73 per ounce, silver is comfortably above its inflation‑adjusted 2011 peak but remains roughly 57–60% below the inflation‑adjusted 1980 high. That does not mean silver must reach $170, since the 1980 surge was largely a market corner rather than an organic price discovery process. The key takeaway is simple: on a real basis, today’s price is not historically expensive.
What the Gold‑Silver Ratio Tells Us About Relative Value
The gold‑silver ratio expresses how many ounces of silver it takes to buy one ounce of gold. It is one of the oldest relative valuation tools in precious metals investing. Crucially, it does not say whether either metal is cheap in dollar terms; it shows which metal is cheap relative to the other.
The ratio currently sits near 62:1 — close to the 50‑year average of about 60:1 and within the 21st‑century average (around 65:1). This places silver broadly in line with its modern historical norm rather than at an extreme. When the ratio ran to 127:1 in March 2020, it reflected a flight to gold during market panic; when it compressed to about 32:1 in 2011, silver significantly outperformed gold.
Using the ratio as a scenario tool helps illustrate possibilities. If gold trades above $5,000 and the ratio falls toward 55, silver would be near the high‑$90s to low‑$100s. If gold advanced further and the ratio compressed similarly, silver could move higher still. These are illustrative scenarios, not predictions.
Why Is the Silver Supply Deficit Significant?
A multi‑year supply deficit is more than a statistical quirk; it is a structural condition that supports prices over time. The Silver Institute projects a 67 million ounce market deficit in 2026 — the sixth year in a row where demand exceeds mine production plus recycling.
Even with total supply near a decade high, demand still outpaces available ounces. Much of the increase in demand is industrial and technology driven: solar photovoltaics accounted for a growing share of industrial silver demand in recent years, and electric vehicles, 5G infrastructure, AI data centers, and medical devices all require silver components.
On the supply side, a large portion of silver is produced as a by‑product of copper, zinc, and lead mining, so output decisions follow base‑metal economics rather than silver prices alone. That makes supply relatively inelastic: deficits can persist even when prices rise, and above‑ground inventories are gradually being drawn down.
The combination of sustained deficits, rising technology demand, and constrained supply is not characteristic of an overvalued market.
Is Silver Undervalued Right Now?
Taken together, the valuation anchors point in the same direction: silver appears undervalued or fairly valued — not overpriced. It sits below long‑run inflation‑adjusted peaks, trades near its long‑run ratio to gold, and is supported by a persistent supply deficit.
That said, undervaluation is not a timing signal. Short‑term headwinds are real: silver pays no yield, so higher for longer interest‑rate expectations tend to pressure its price. Geopolitical developments and temporary weakness in industrial demand can also weigh on performance in the near term.
The bear case is primarily cyclical: a sharp global slowdown would reduce industrial silver consumption, solar manufacturers may lower silver intensity per panel, and substitution pressures could accelerate in some markets. These are plausible risks, and they help explain why prices can remain muted even when structural demand looks strong.
The distinction matters: cyclical forces can suppress price for months or even years, while structural drivers determine the metal’s long‑term floor. A cyclical pullback does not negate the structural case.
What Would Actually Move Silver Higher?
Analysts’ forecasts for 2026 vary, with some large institutions projecting averages in the low‑80s per ounce and higher seasonal levels later in the year. More generally, three practical catalysts would drive silver appreciably higher:
Rate cuts. If central banks ease monetary policy, the gold‑silver ratio often compresses as investors reallocate into both metals. Silver’s higher beta to gold could amplify an upward move.
Physical tightness. Continued deficit‑driven drawdowns of exchange inventories and available physical supply can create sharp price moves as traders and industrial buyers compete for scarce ounces.
Confirmed industrial demand growth. Sustained increases in silver use from solar, electric vehicles, and data infrastructure would raise long‑term demand assumptions in analyst models and justify higher price targets.
These catalysts do not require extraordinary events — they require a continuation of the macro and structural trends that already underpin the market.
Stay On Top of Gold & Silver Prices
Receive timely market alerts and concise analysis delivered to your inbox.
Sign up for alerts and short market notes to stay informed about price action and structural developments.
People Also Ask
What is the fair value of silver per ounce?
There is no single definitive number. Using inflation‑adjusted history, the gold‑silver ratio, and current supply‑demand dynamics, many analysts place fair value in a range roughly between $80 and $120 per ounce. That range reflects different scenarios for gold, macro policy, and industrial growth rather than disagreement about the metal’s long‑term direction.
Is silver undervalued in 2026?
By several long‑run measures, yes. Silver sits about 40% below its January 2026 nominal high, well below its inflation‑adjusted 1980 peak, and is trading into a sixth consecutive annual supply deficit. The gold‑silver ratio is near its long‑run average, indicating silver is not deeply cheap or expensive relative to gold — yet structural factors point toward higher long‑term value.
What was silver’s inflation‑adjusted all‑time high?
The 1980 intraday peak of $49.45 translates to about $170–$195 per ounce in today’s dollars, depending on the CPI measure used. By that metric, the nominal 2026 high has not surpassed the real 1980 peak.
What is the gold‑silver ratio and why does it matter?
The gold‑silver ratio is the price of gold divided by the price of silver and shows how many ounces of silver buy one ounce of gold. Long‑term averages provide context: when the ratio is elevated, historical recoveries have often favored silver; when compressed, silver has historically underperformed. It is a relative valuation tool rather than an absolute price forecast.
Why does silver keep selling off if it’s undervalued?
Short‑term price action is driven by macro and cyclical factors, while structural value unfolds over years or decades. Silver is a non‑yielding asset and tends to fall when interest rates are expected to remain high. Industrial demand and growth expectations also influence near‑term direction. The market can be undervalued structurally while still moving lower in the short run.
So Where Does That Leave You?
Three frameworks, one conclusion: silver’s structural picture is supportive. It trades well below its inflation‑adjusted 1980 peak, it faces a multi‑year supply deficit, and the gold‑silver ratio sits near its long‑run average. Near‑term risks — elevated rates, geopolitical uncertainty, and cyclical industrial weakness — can delay or reverse price gains temporarily, but they do not erase the structural case.
Monetary metals are priced over long horizons. Silver’s fair value over that horizon is likely higher than current levels. The practical question for investors is whether to establish or increase a physical position now or wait for clearer cyclical signals. If you plan to build a physical allocation, consider secure, reputable storage and a disciplined, long‑term approach.
SOURCES
1. Investing News Network — Silver All‑Time High Price
2. InflationData.com — Inflation‑Adjusted Silver Prices
3. Trading Economics — Silver Price
4. Silver Institute — Analysis and market reports
5. Silver Institute — Supply and demand forecasts for 2026
6. Silver Institute — Demand forecasts across key technology sectors
7. Industry commentary on silver substitution and solar trends
8. J.P. Morgan Global Research — Silver price outlook and analysis
Disclaimer: This article is for informational and educational purposes only and does not constitute investment advice. Consult a qualified financial adviser before making any investment decisions.
You may also like:
- Gold or Silver Price Dip: Temporary Correction or Trend Reversal?
- What Switzerland’s Gold Freeze Means for Investors
- What History Shows About Buying Gold After a Pullback
- Should You Sell Gold During a Bull Market Pullback?
- Silver Bullion Buying Guide 2026: Coins, Bars, and Rounds Compared
- Is Gold Still a Strategic Asset for Your Portfolio?
- Best Gold Investment in 2026: Bars, Coins, IRA or ETF?
- What Happens to Gold When the Dollar Crashes?
Popular Topics
Picked from the archive
-
01
 Topics
Gold Up 3% and Silver 7% as Metals Rally to End Q1
-
02
Topics
Tariff Deadline Sends Copper Prices 40% Higher in 2025
-
03
Topics
Why Big Banks Predict Gold Prices Over $6,000
-
04
Topics
Gold Price Reaction to Jobs Report – Pre-Market Guide
-
05
Topics
Middle East Tensions Lift Gold Prices; Platinum Hits 2021 High
-
06
Topics
How Government Debt Drives Gold and Silver Prices
-
07
Topics
U.S. Debt Tops $38T; J.P. Morgan Forecasts Gold Above $5,000
-
08
Topics
COMEX Silver First Notice Day: Key Events to Watch April 30