
The gold/silver ratio stands at 66.3 today. Three months ago it was 61.7, and five weeks ago it reached 70.4. Between those points the ratio traced most of that range more than once. That level of movement is not random noise; it reveals how these two metals behave relative to each other and why looking at a single-day price change can miss the larger dynamic at work.
What is the gold/silver ratio doing today?
Gold is down about 0.7% on the day and trading near $4,400 an ounce as investors price in rising real yields ahead of an upcoming Federal Reserve meeting. At the same time, renewed tensions affecting shipping routes have supported a modest safe-haven bid. Silver is essentially flat, sitting close to $66.30. Because gold is the metal giving ground today, the ratio has moved toward the lower end of its recent range rather than the higher end.
That pattern has repeated several times in recent weeks. When expectations for interest rates push gold lower, silver often holds steadier instead of falling in lockstep. Conversely, when gold rallies, silver lately has tended to rally more strongly. Neither metal tracks the other one-for-one; the gold/silver ratio captures that divergence.

The Edge Every Investor Needs
Smarter precious metals investing starts here. The Nuggets Newsletter brings essential market insights, Fed updates, global trends, educational videos, and timely commentary.
Why did the gold/silver ratio swing from 61.7 to 70.4 and back?
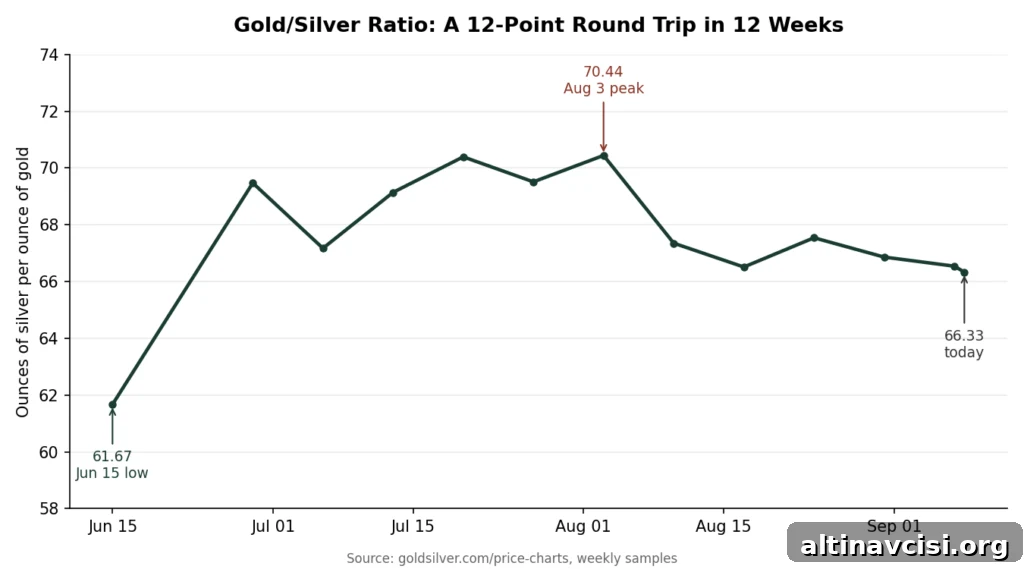
In mid-June the ratio was near 61.7, one of the tightest readings of the year, implying silver was relatively expensive versus gold by recent standards. By early August the ratio widened to 70.4, signaling the opposite: silver had become relatively cheap compared with gold. Five weeks later the ratio moved back toward the mid-60s, around 66.3.
A 12-point swing in a ratio that often moves in single digits over a similar timeframe is a signal of market volatility rather than a shift in some fixed “correct” level. Silver’s investable market is much smaller than gold’s in both mine supply and the dollar value of above-ground stocks. That means a given dollar of buying or selling pressure will move silver’s price more than it will move gold’s. The ratio records that difference in market depth: it reflects how much thinner silver’s market is, and how that structural difference amplifies price swings.
What mechanism is driving both metals right now?
Short-term moves in gold are dominated by changes in real yields — the inflation-adjusted return on Treasury securities. With real yields rising into the Fed meeting, gold tends to give back gains because it yields nothing. Silver faces the same macro headwind, but its demand mix includes a significant industrial component: solar panels, electronics, and other applications that require silver and have few large-scale substitutes. That industrial demand provides a partial floor to silver’s price and helps explain why silver has not fallen as much as gold during the same rate-driven pullback.
Both metals also embody the “sound money” case to varying degrees: they sit outside the banking system’s liability structure and cannot be created by central bank balance-sheet expansion. Over many rolling multi-year windows in recent decades, both have preserved purchasing power better than fiat currency in many cases. The ratio does not overturn that thesis; it simply shows whether short-term moves in a combined precious-metals position are being driven more by silver or by gold at any given moment.
What should this round trip change about how you hold gold and silver?
Think of silver as the higher-beta portion of a metals allocation and gold as the lower-beta core. Silver captures more of the upside when both metals rally and gives back more when the move reverses. That asymmetry is the reason to size silver positions with care rather than treating any single ratio print as a trigger to switch entirely from one metal into the other.
Managing allocations with the expected volatility of silver in mind is a durable approach. The recent cycle — from roughly 61.7 to 70.4 and back to about 66.3 — illustrates why a measured allocation strategy, rather than an all-or-nothing trade based on a single ratio reading, is generally wiser for most investors.
Gold and silver price levels referenced here are contemporary to the original reporting. Ratio history refers to weekly market data spanning mid-June through early September 2026.
Stay On Top of Gold & Silver Prices
Get important market alerts sent straight to your inbox.
SOURCES
1. GoldSilver — Small Market, Big Swings: Why Silver Is More Volatile Than Gold (Mar 31, 2026)
2. GoldSilver — The Fed Just Priced Out Half a Rate Hike. Gold Barely Noticed. (Sep 3, 2026)
3. GoldSilver — Silver Industrial Demand: Solar, EVs, and the Supply Gap (May 22, 2026)
4. GoldSilver — Gold Portfolio Allocation: Why Wall Street Is Rewriting the 60/40 (May 28, 2026)
5. Yahoo Finance — Silver Prices Today, Tuesday, September 8, 2026 (Sep 8, 2026)
6. Yahoo Finance — Gold Prices Today, Tuesday, September 8, 2026 (Sep 8, 2026)
7. Fortune — Current Price of Gold: September 8, 2026 (Sep 8, 2026)
8. TradingEconomics — Silver Price, Chart, Historical Data (Sep 8, 2026)
Disclaimer: This article is for informational purposes only and does not constitute investment advice. Past performance is not indicative of future results. Consult a qualified financial advisor before making investment decisions.
You May Also Like:
- Gold Is Falling Today. Four Other Signals Say the Hard-Assets Trade Isn’t.
- Gold Is Falling for a Reason Most Investors Have Backwards
- Even Central Banks Don’t Trust Someone Else’s Vault Anymore
- Gold’s Dip Below $4,400 Didn’t Scare Wall Street. Here’s Why.
- China Just Broke Its Own Gold-Buying Record. Then Broke It Again.
- The BLS Revised April Up 64,000, Then Down 31,000. Gold Traded the First Print.
- Gold’s Drop Was the Easy Story. The Bond Market’s Non-Reaction Is the Real One.