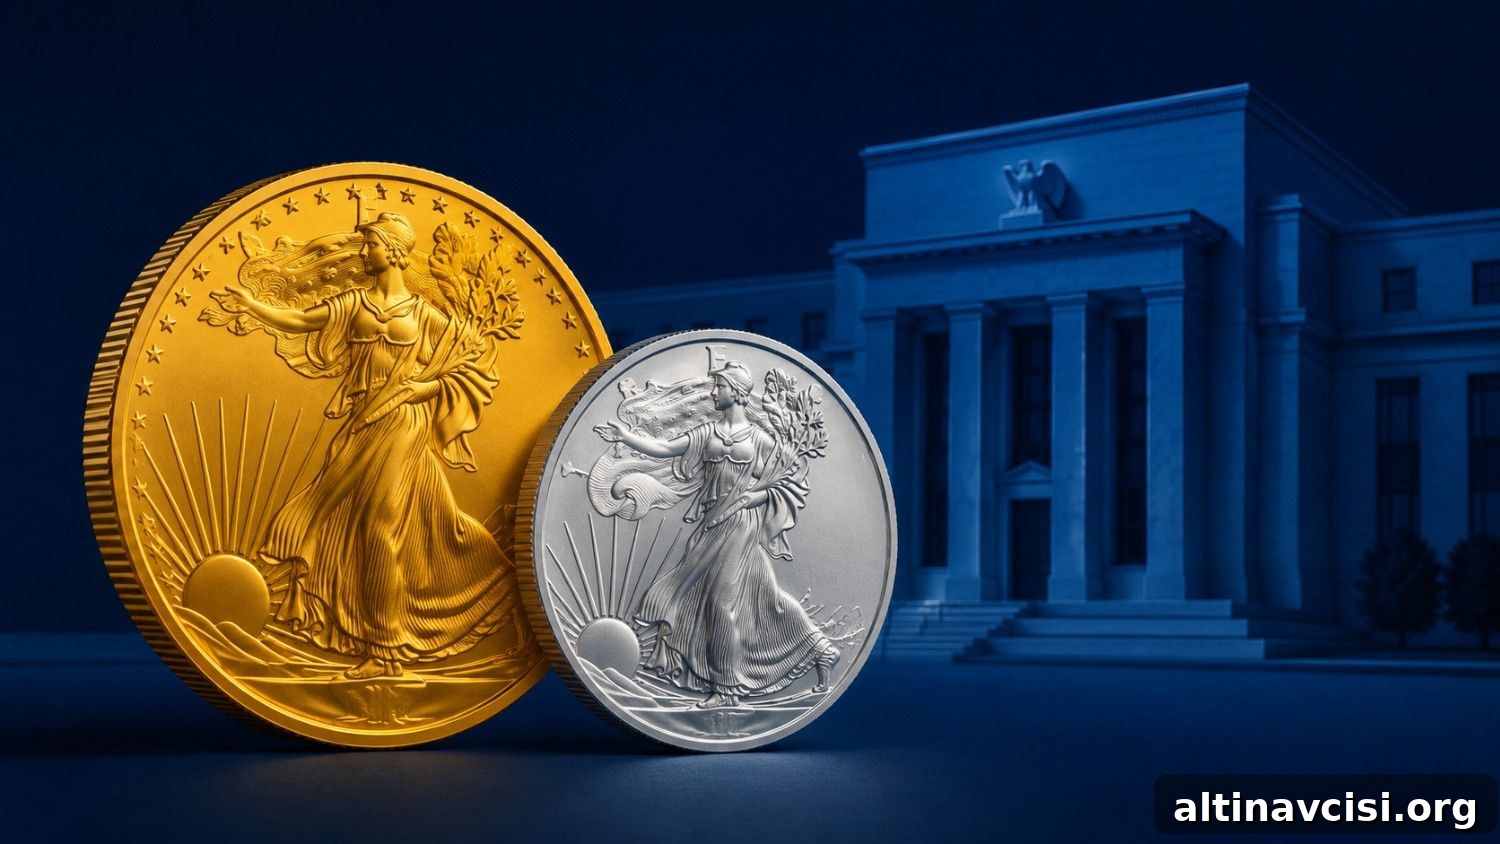
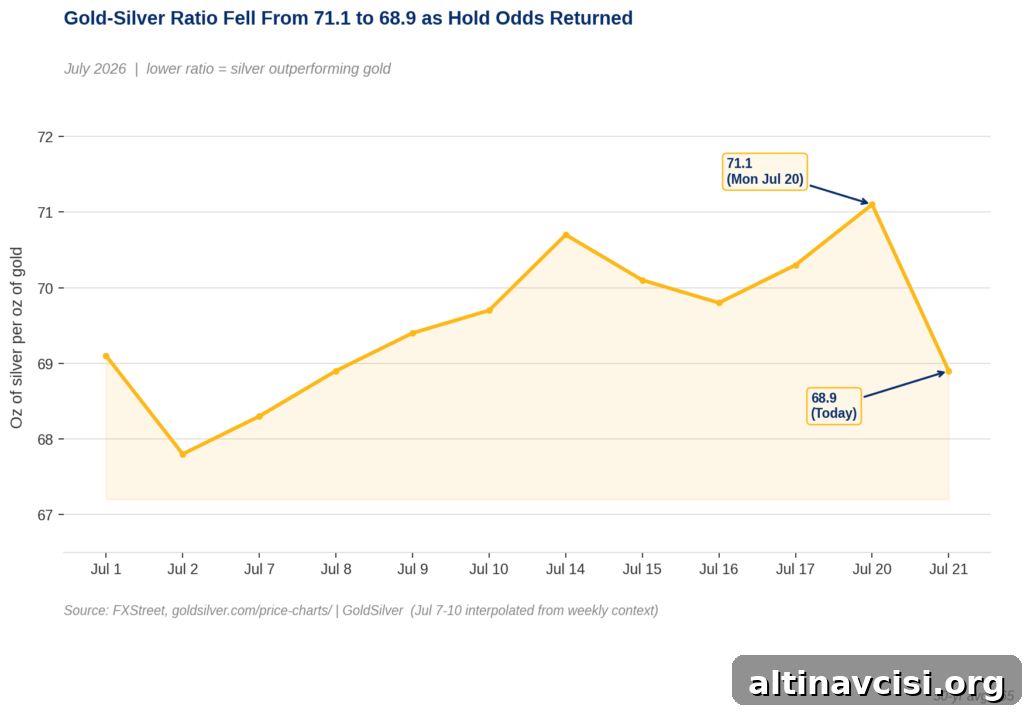
Gold traded at $4,077 per ounce on Tuesday, a 1.7% rise from its opening level of $4,007. Silver posted a larger move, climbing 4.6% to $59.03 after recovering from a selloff that pushed it below $55 last week. As a result, the gold-silver ratio fell from 71.1 on Monday to 68.9 on Tuesday, a shift that highlights where traders are placing their bets.
The Federal Open Market Committee (FOMC) meets next week on July 28–29, with the rate decision scheduled for the evening of Wednesday, July 29. The market’s reaction to that decision and the data that follow could shape precious metals prices in the days after.
Why Do Markets Expect the Fed to Hold Rates on July 29?
Markets largely base their expectation of a pause on the June Consumer Price Index. On July 14, the Bureau of Labor Statistics reported headline CPI easing from 4.2% in May to 3.5% year over year — the largest monthly drop since April 2020. Core CPI also moved lower to 2.6%. Those readings sharply reduced the probability investors assigned to a July rate hike.
Following the CPI release, the market-implied chance of a July rate increase fell dramatically in one trading session. Since that move, probabilities have stabilized. As of late Monday, tools that track Fed pricing put the odds of the FOMC leaving the federal funds rate unchanged at roughly the high 80s percent range. That consensus — a likely hold — plays out in both bond and metals markets.
For gold specifically, a hold typically means real (inflation-adjusted) yields remain steady. Gold tends to move inversely to real yields: when the opportunity cost of holding a non-yielding asset is unchanged, gold tends to maintain its price. The modest rise in gold today reflects that pricing-in of a hold; the market already appears to have baked this outcome into current levels.
The Edge Every Investor Needs
Smarter precious metals investing starts here. The Nuggets Newsletter delivers timely market commentary, Fed updates, supply and demand insight, and clear educational content for both new and experienced investors.
What Does Today’s Silver Surge Actually Mean?
Silver’s 4.6% jump today is not driven solely by the same forces influencing gold. Instead it reflects a combination of monetary and industrial drivers that can make silver move more aggressively.
Silver responds strongly to shifts in interest-rate expectations. Historically, when rate-hike odds drop, silver has tended to move two to three times the percent change of gold because it combines monetary sensitivity with distinct industrial demand. Roughly 58% of annual silver demand comes from manufacturing and technologies such as solar panels, electric vehicles, and data centers supporting artificial intelligence. When monetary conditions ease and industrial demand appears resilient, the price reaction in silver can be magnified.
When monetary tailwinds and improving industrial sentiment align, silver’s gains appear outsized compared with gold. The one-day fall in the gold-silver ratio from 71.1 to 68.9 signals that investors are pricing both a likely Fed hold and a renewed pickup in industrial demand after last week’s selloff.
Beyond short-term cycles, the silver market also faces structural tightness. Analysts project that 2026 will mark the sixth consecutive annual supply deficit, with demand outpacing supply by a substantial margin. That ongoing imbalance creates a structural floor under prices; when monetary conditions ease or demand expectations recover, the resulting upside can be amplified because available supply is already constrained.
What Will Actually Move Gold After the Fed Decision?
Many headlines will focus on the FOMC announcement itself. While the Fed’s July 29 rate decision matters, a hold that markets already expect is unlikely to trigger a large immediate reaction in gold. The more consequential move may come from the data released the following morning.
The Bureau of Economic Analysis will publish the June Personal Consumption Expenditures (PCE) price index at 8:30 a.m. ET on July 30. The Fed favors PCE as its preferred inflation gauge, so the June PCE print will carry significant weight. The FOMC’s June projections also revealed a split among policymakers: roughly half signaled at least one hike could be appropriate later in the year, while others did not. That division leaves September’s path uncertain.
If the June PCE reading is cooler than expected, markets would likely lower odds of a September hike and real yields could ease, giving gold room to extend its recovery toward and above recent resistance levels. If PCE comes in hotter than anticipated, the faction leaning toward further hikes would gain momentum, real yields would likely rise, and any gold recovery could stall. In short: the Fed’s decision is a scheduled and partially priced event; the PCE print that follows is the uncertain data point that may move markets more decisively.
What Does a Gold-Silver Ratio of 68.9 Tell Investors?
The gold-silver ratio measures how many ounces of silver are required to purchase one ounce of gold. At 68.9, the ratio remains above its approximate 50-year average near 65. A higher ratio implies silver has underperformed gold; a falling ratio indicates silver is catching up.
The ratio reached 71.1 as recently as Monday after stronger-than-expected manufacturing data briefly raised rate-hike odds. The subsequent compression to 68.9 reflects the market’s reversion to the consensus view that the Fed will hold. For investors who own both metals, a falling ratio suggests monetary conditions are shifting in silver’s favor and that industrial demand expectations have improved.
Keep an eye on the July 30 PCE release. While the FOMC announcement will be important, the inflation print that follows may be the actual catalyst for a meaningful move in gold and the gold-silver ratio.
Stay On Top of Gold & Silver Prices
Receive timely market alerts and price updates directly to your inbox.
SOURCES
1. GoldSilver — Live gold and silver spot prices, July 21, 2026
2. Bureau of Labor Statistics — Consumer Price Index Summary, June 2026 (released July 14, 2026)
3. CME Group — Fed pricing and implied probabilities, July 2026
4. Federal Reserve — FOMC projections and summary, June 17, 2026
5. Bureau of Economic Analysis — PCE price index release schedule, July 30, 2026
6. Silver Institute — World Silver Survey 2026 (research by Metals Focus, April 2026)
Disclaimer: This article is for informational purposes only and does not constitute financial or investment advice. Consult a qualified financial adviser before making investment decisions.
You May Also Like:
- Silver Is Up Nearly 5% This Morning. Here Is Exactly Why.
- China Ends Paper Gold Trading July 24. For Physical Holders, That’s a Confirmation.
- Silver Is Up 1.5% Today. Oil Is Up 3%. Those Two Moves Shouldn’t Coexist. Here’s Why They Do.
- Hong Kong Just Ran Its First Gold Settlement. The Banks Who Did It Also Run London’s.
- Consumer Inflation Expectations Just Fell to 4.2%. Gold Fell Too. The Survey Missed the Oil Spike.
- Gold Fell 3.4% This Week. The Long-Term Case Didn’t.