
Gold declined about 1.1%, trading near $4,369 per ounce by midday Tuesday, August 18, 2026. The move came as the 30-year Treasury yield climbed above 5.33%, marking the highest level in 19 years. The key explanation is rising real yields: long-term borrowing costs increased while investors’ inflation expectations remained near 2.3%, raising the after-inflation return available from safe assets.
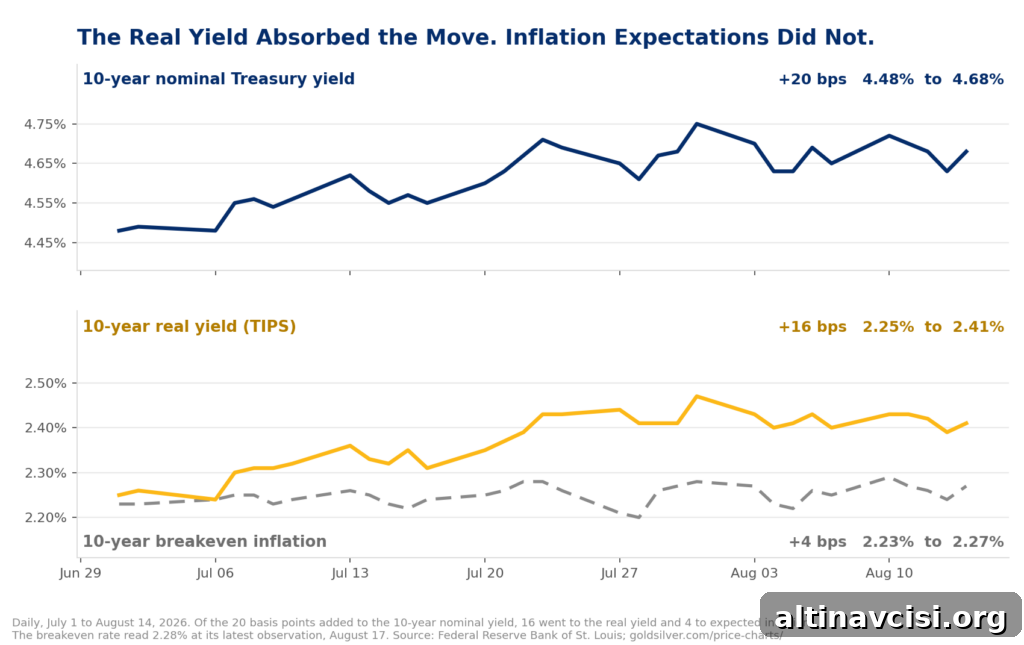
Investors required higher compensation to lend to the U.S. government for three decades than at any point since 2007, while the market’s expected inflation for the next ten years showed little change. That combination—higher real yields alongside stable inflation expectations—is the main driver behind gold’s weakness on the day.
Silver fell more sharply, dropping roughly 2.7% to $64.00 per ounce. That widened the gold-to-silver ratio from about 67.1 on Monday to roughly 68.3 by midday Tuesday, reflecting a relative underperformance in silver versus gold.
What Happened in the Bond Market on Tuesday?
The 30-year Treasury yield topping 5.33% was the highest reading since 2007. Through the morning session, the long bond traded near 5.32%. At the same time, 10-year Treasuries yielded about 4.73% and two-year notes about 4.19%. These moves reflected a repricing of long-term risk and supply more than a shift in inflation expectations.
A primary catalyst was fiscal: the Treasury reported a very large July deficit—measured in the hundreds of billions—driving substantial market issuance and raising term premia. Fiscal-year borrowing has risen sharply and now exceeds the total for fiscal 2025, putting pressure on long-term yields. Global borrowing costs moved higher as well, suggesting this was not an isolated U.S. phenomenon.
Why Did Gold Fall While Treasury Yields Rose?
For gold, the relevant metric is the real yield—the nominal yield minus expected inflation—not the headline nominal yield. When real yields rise, the opportunity cost of holding non-yielding assets like gold increases.
The 10-year breakeven inflation rate, the bond market’s built-in forecast of average inflation over the next decade, was around 2.28% in mid-August, effectively unchanged for the week. By contrast, the 10-year real yield (from inflation-protected securities) rose to about 2.41% on August 14. Since July 1, the 10-year nominal yield moved up roughly 20 basis points; about four basis points of that came from higher breakevens, while the remaining roughly 16 basis points were an increase in the real yield.
Historical analysis suggests a meaningful negative relationship between real yields and inflation-adjusted gold prices. For example, some studies show that a 100-basis-point rise in real yields has often coincided with a sizeable decline in gold’s inflation-adjusted value. Market watchers often flag a real yield near 2.5% as a threshold where the relative attractiveness of holding gold diminishes—current readings are close but slightly below that level.
It is important to note that relationship changed somewhat during 2024–2025, when central bank purchases replaced investor flows through ETFs as a dominant marginal source of demand for physical gold. While real yields still influence the broader direction of gold over full market cycles, they do not drive prices in isolation any longer.
Is This an Inflation Story or a Credit Story?
This episode is more of a credit story than an inflation story. Economists refer to the extra compensation investors demand to hold long-duration government bonds as the term premium. That premium covers duration risk, supply risk, and the risk that the issuer’s fiscal position deteriorates. It is not itself an inflation forecast. Breakeven rates capture inflation expectations, and those rates remained largely unchanged.
Economic data for July showed weaker demand in some areas—retail sales fell and producer prices were flat—conditions that would normally ease yields. Instead, yields rose, indicating markets were re-evaluating credit and supply dynamics rather than anticipating higher inflation. In short, the bond market repriced borrowers and issuance risks, not the expected path of consumer prices.
What Are the Fed and Wall Street Saying About Real Rates?
Federal Reserve officials have noted that higher nominal and real rates tighten financial conditions and can substitute for policy rate increases. In recent communications, some Fed participants emphasized that tighter financial conditions argued for patience on rate moves. The Federal Open Market Committee left its policy range unchanged at that meeting, though several committee members preferred a tighter stance.
Market strategists and technical analysts differ on forecasts for long-term yields; some expect further upward movement in the long end, which, if realized, would continue to push real yields higher and maintain pressure on precious metals.
What Does the Bear Case Get Right?
The bearish argument for gold centers on rising real yields: at current real rates, cash and inflation-protected bonds deliver a positive real return that gold does not. If real yields continue to climb while breakeven inflation stays near current levels, gold faces a sustained headwind.
That view correctly identifies the directional pressure from rising real yields. But it does not fully address why those yields are rising—fiscal pressures and higher government debt service costs play a central role, which complicates the long-term outlook for nominal dollar assets.
What Does a 19-Year-High Long Bond Mean Over Five Years?
The same fiscal forces that lift real yields can also erode the value of long-term nominal bonds as a store of value. Rising interest costs on the federal debt have become a larger share of government revenues, increasing deficits and likely driving further issuance. That feedback loop pushes term premia higher and raises the fiscal burden of servicing debt.
A U.S. Treasury bond is a promise to pay dollars; gold is a physical asset that does not depend on promises. Higher real yields make that promise more attractive in the short term, but the fiscal and structural reasons behind rising yields make the long-term reliability of that promise more uncertain. This tension helps explain why central banks continued to buy substantial quantities of gold even while prices were drifting lower—gold can act as non-sovereign collateral in an uncertain fiscal environment.
What Should You Watch Next?
Focus on the spread between nominal yields and breakeven inflation—the real yield—rather than the headline nominal rate alone. Upcoming central bank minutes and policy signals are likely to move breakevens first. If the 30-year yield continues to climb while breakevens remain near current levels, real yields will rise further and maintain downward pressure on metals. Conversely, if breakevens increase and close the gap, the upward momentum in real yields will stall and relieve some pressure on gold and silver.
Monitor fiscal developments, Treasury issuance patterns, and central bank demand for physical gold. All three will influence price dynamics in the months ahead. Key monetary policy meetings and official communications should be watched closely for signs that the inflation or policy outlook is shifting.
SOURCES
1. CNBC coverage of Treasury yields and market reactions (August 18, 2026). 2. Federal Reserve Bank of St. Louis data on 10-year breakeven inflation and Treasury yields. 3. PIMCO research on historical relationships between gold and real yields. 4. World Gold Council reporting on central bank gold purchases. 5. Fiscal and debt commentary from public budget trackers and analyses. 6. U.S. Treasury Monthly Treasury Statement, July 2026. 7. Spot gold and silver price data from market price charts.
Disclaimer: This article is for informational purposes only and does not constitute investment advice. Past performance does not guarantee future results. Consult a qualified financial advisor before making investment decisions.
You May Also Like:
- FOMC Minutes Tomorrow. Jackson Hole in Nine Days. Here Is What Gold Needs From Both.
- Three Fed Officials Voted to Hike. What It Means for Gold.
- Why Is Gold Not Going Up? The Bears Vanished in June.
- JP Morgan Just Flagged a Silver Demand Warning. Silver Rose Anyway. Here Is Why.
- Gold Needed One Thing to Break $4,400. It Just Got Five of Them.
- Zero Tankers Crossed Hormuz on Sunday. Oil Hit $89. Gold Barely Moved.