Is the Petrodollar Ending? What Iran War Means for Gold Prices

Gold and Silver market update — April 16, 2026
In this update: gold holds near $4,828 as the dollar hits a 7-session low · Deutsche Bank flags pressure on the petrodollar · silver crosses $80 amid a sixth straight supply deficit · the Fed’s own study links tariffs to most excess goods inflation · why war headlines don’t move gold the way many investors expect
Why is gold holding near $4,828 today?
The U.S. Dollar Index (DXY) has just recorded its seventh straight daily decline, sliding toward 98 — the lowest level since before the Iran conflict began. That weakness in the dollar is a primary driver for gold.
The mechanism is straightforward: a softer dollar makes gold cheaper for buyers using other currencies, broadening demand. Increased buying at current prices tends to push gold higher.
There is a deeper signal beyond currency mechanics: both the dollar and gold reflect confidence in monetary stability. When investors worry about a currency’s long-term purchasing power, capital flows toward assets that cannot be printed. Gold is the principal beneficiary of that shift.
The downside case is clear: a rapid resolution to the Iran conflict combined with a hawkish U.S. Federal Reserve pivot would boost real yields and weigh on gold. That scenario is plausible but requires several events to occur together. Chicago Fed President Austan Goolsbee warned on April 15 that rate cuts could be pushed into 2027 if energy prices remain elevated, a view that keeps upward pressure on the dollar limited and supports gold’s new floor.
The Edge Every Investor Needs
Smarter precious metals investing starts here. The Nuggets Newsletter brings concise market insights, Fed updates, global trends, and educational content.
Subscribe to receive free market alerts and concise commentary on gold and silver prices.
Is the Iran war ending the petrodollar?
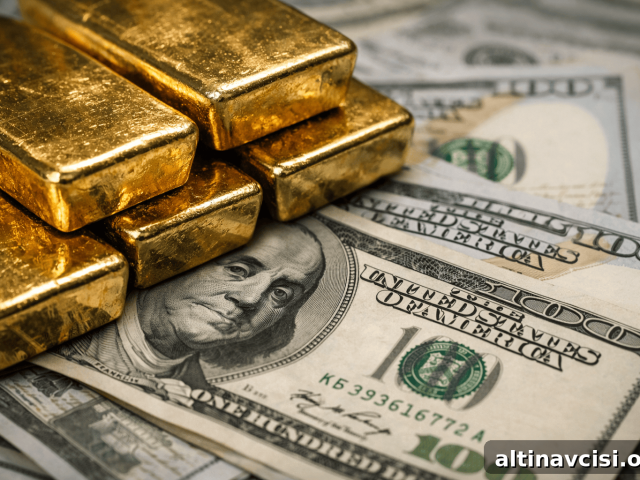
Deutsche Bank FX strategist Mallika Sachdeva described the U.S.–Iran conflict as “a perfect storm for the petrodollar.” The petrodollar system, established in 1974, relies on major Gulf producers pricing oil in dollars and reinvesting surpluses in U.S. Treasuries, which has supported structural demand for the dollar for decades.
Sachdeva’s concern centers on security guarantees: if U.S. military protection in the Gulf weakens, Gulf states may have less incentive to hold reserves in dollars. There are also reports of discussions around yuan-denominated tolls for tankers transiting the Strait of Hormuz, which could further erode dollar demand.
However, other analysts reach a different conclusion. Diana Choyleva of Enodo Economics argued the conflict has actually reinforced the petrodollar by demonstrating U.S. military resolve, at least in the short term. Both perspectives have merit.
What both sides acknowledge is a longer-term trend: the dollar’s share of global foreign-exchange reserves has declined from roughly 71% in 1999 to about 57% today. That shift appears structural, not merely cyclical. As the dollar’s share erodes, gold is among the assets positioned to benefit.
Why is silver above $80 — and is the rally sustainable?
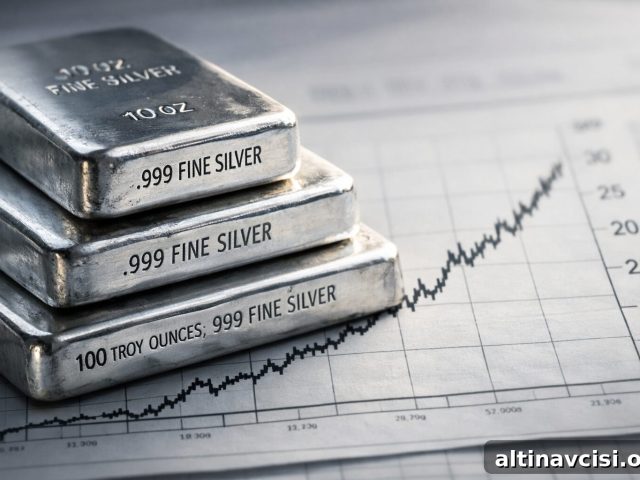
Silver climbed above $80 per ounce on Thursday. The same monetary forces helping gold — a weaker dollar and lower real yields — support silver, but an important supply-side story sets this rally apart.
The Silver Institute’s World Silver Survey 2026 projects a sixth consecutive annual deficit for silver, estimating a 2026 shortfall of about 46.3 million troy ounces, roughly 15% larger than 2025. Since 2021, approximately 762 million troy ounces have been drawn from above-ground inventories to cover persistent deficits — nearly a full year of global mine production withdrawn over five years.
Notably, industrial demand is expected to decline by about 2% in 2026 as some manufacturers, including solar panel producers, substitute away from silver. The persistent deficit is therefore being driven more by rising investment demand than by industrial use: bar and coin purchases are forecast to increase by roughly 18% this year.
The gold-silver ratio sits near 60:1, below its 30-year average. Historically, such compression occurs when real yields fall and physical demand tightens — both of which are present today — supporting silver’s upside potential.
Did tariffs cause consumer goods inflation — and what can the Fed do about it?
A Federal Reserve Board study released April 8 found that tariffs imposed through November 2025 raised core goods PCE prices by roughly 3.1% through February 2026, and that these tariffs account for essentially all the excess inflation in the core goods category since January 2025. Absent those tariffs, goods prices likely would have returned below pre-pandemic trend levels.
That distinction matters for monetary policy because the Fed’s main tool — raising interest rates — reduces demand but cannot lower the price of tariffed imports. In short, tariffs create a form of inflation that monetary policy struggles to correct directly.
An internal Fed study from the Federal Reserve Bank of Minneapolis, published the same week, questions whether tariff pass-through is the sole driver. The differing findings within the Fed reflect real uncertainty about policy effectiveness.
For precious metals investors, the takeaway is important: tariff-driven inflation tends to compress real yields for longer periods — a structural environment in which gold and silver have historically performed well.
Why doesn’t gold always go up when there’s a war?
Recent events offer a clear example. Stalled ceasefire talks and disruptions near the Strait of Hormuz produced major headlines, yet gold’s move was muted and silver briefly dipped. Investors expecting a simple, immediate flight-to-safety response were often surprised.
The reality is that gold does not react to fear alone; it reacts to what that fear implies for inflation and monetary policy. Disruptions that sustain higher oil prices feed into consumer inflation. If the Fed is constrained from hiking aggressively because employment is slowing, real yields remain depressed — and depressed real yields are the true structural driver for gold.
Crude traded near $91.66 per barrel on April 16 — below recent peaks but still elevated in historical terms. Combined with signals from Fed officials that rate cuts may be delayed, the conditions favor persistent real yield compression rather than short-lived spikes.
The meaningful change since the conflict began is the new floor for precious metals, not daily volatility. Gold has not fallen back to pre-conflict levels, and silver, although below its January 2026 peak above $100/oz, has not collapsed. Historically, a ceasefire often triggers only a modest 3–5% unwind of the risk premium; that has not occurred. The shift in the baseline is the crucial development.
Stay On Top of Gold & Silver Prices
Get timely market alerts delivered to your inbox.
Current prices updated frequently — check your preferred market data source for live quotes.
Subscribe to short-form updates and price alerts (form removed for privacy).
SOURCES
1. Federal Reserve Board — Detecting Tariff Effects on Consumer Prices in Real Time – Part II · Minton, Ray, Somale (April 8, 2026)
2. Deutsche Bank Research — What Iran means for the dollar: a perfect storm for the petrodollar · Mallika Sachdeva (March 24, 2026)
3. Silver Institute — World Silver Survey 2026 (April 15, 2026)
4. Trading Economics — DXY U.S. Dollar Index
5. Trading Economics — Silver Spot Price
6. USAGOLD — Daily Precious Metals Market Report (April 16, 2026)
7. Fortune — Daily Gold Price (April 16, 2026)
8. Fortune — Daily Silver Price (April 16, 2026)
By the GoldSilver Editorial Team — helping investors understand sound money since 2005. This article is for informational purposes only and does not constitute financial, investment, or tax advice. Consult a qualified financial advisor before making investment decisions.
You May Also Like
- France’s Gold Repatriation Is Done. Germany Is Next
- Gold/Silver Ratio Hits 61.1 — Silver’s Turn to Run
- Silver Holds Near $80 as Iran Ceasefire Revives Rate-Cut Bets
- The Fed Goes Silent in 3 Days – What Does That Mean For Gold?
- Gold Is Down 10% From Its War-Peak — and Still Up 46% in a Year
- Gold Outranks the Dollar at Central Banks — What It Means for Your Savings
- Hormuz Blockade Sent Gold Down 2%. Here’s Why That’s Bullish
- Gold Jumps 2% as Trump Plans Iran War Address Tonight
Popular Topics
Picked from the archive
-
01
 Topics
Gold Prices Rise on Fed Policy, Debt Concerns and Asian Demand
-
02
Topics
How Gold and Silver Reduce Losses and Boost Portfolio Returns
-
03
Topics
U.S. Eyes Pakistan’s $6T Mineral Wealth in Economic Partnership
-
04
Topics
Silver Price Forecast 2026-2027: Bull and Bear Scenarios
-
05
Topics
Gold Price Surges Past $5,000 Amid Bond Market Turmoil
-
06
Topics
Paper Gold vs Physical Gold: Safety and Investment Risks
-
07
Topics
Record Gold Floods Shanghai as Traders Exploit Futures Arbitrage
-
08
Topics
Gold Price: What Could Drive It to $6,300?