Key Takeaways
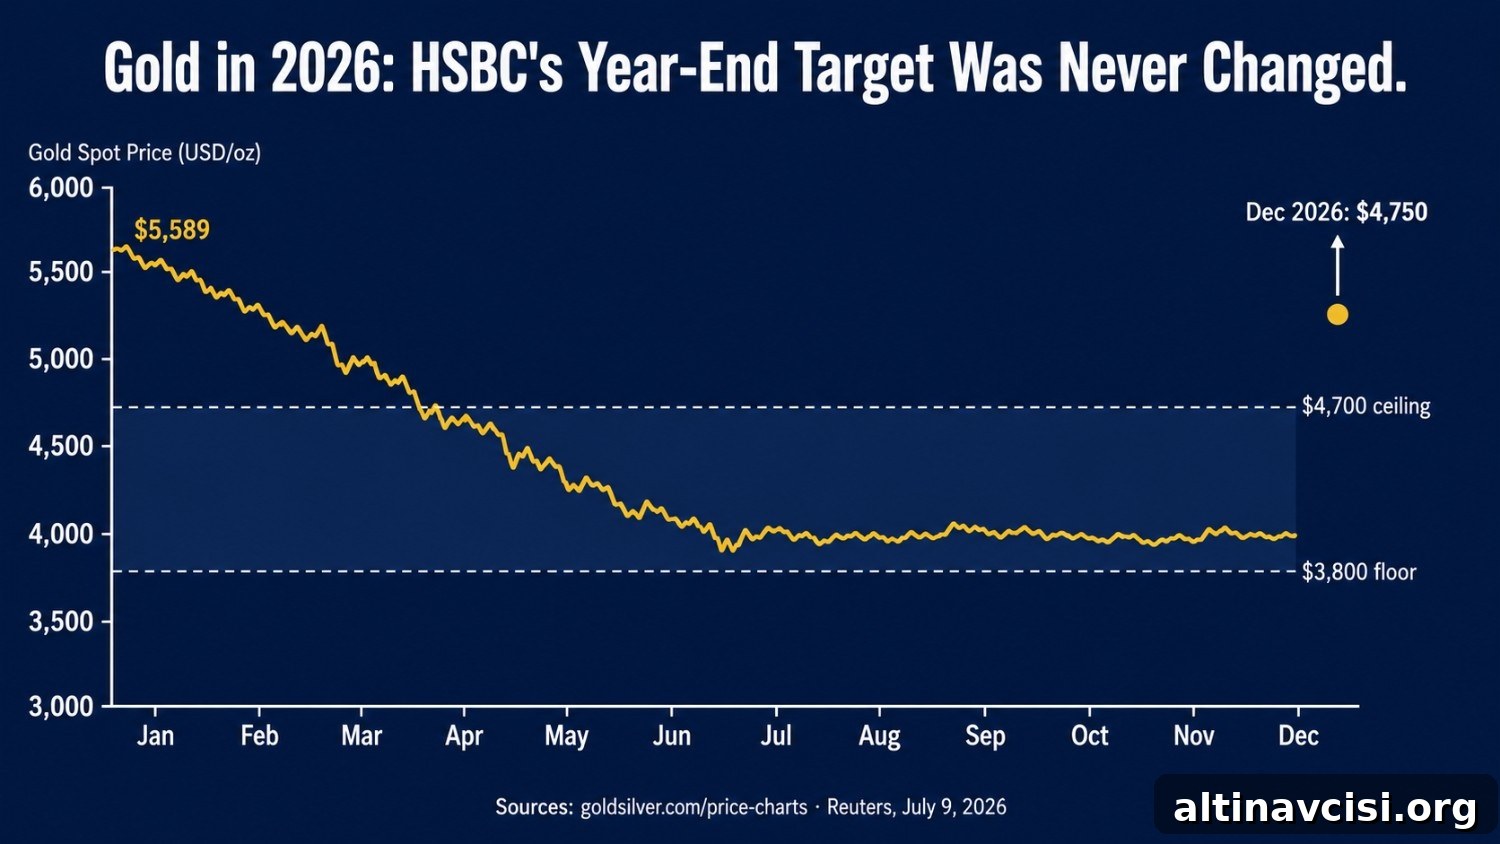
- HSBC reduced its 2026 average gold forecast to $4,560 from $4,864 on July 9, 2026, while keeping its year-end target at $4,750. The gap between the average and year-end target is the important signal.
- The structural drivers behind the 2024–2025 gold bull run — sovereign de-dollarization, widening fiscal deficits, and continuous central bank accumulation well above historical norms — were not changed in HSBC’s update.
- Central banks added 244 tonnes of gold in Q1 2026, a year-over-year increase and above the five‑year quarterly average, buying through some of the highest prices on record.
- The gold-silver ratio sits around 70:1, above its 50‑year average of roughly 65, while silver is entering a sixth consecutive year of supply deficit.
- For long-term holders, the upcoming Federal Reserve meeting is short-term noise. The structural case for precious metals does not hinge on the next rate decision.
Sources: goldsilver price charts and Reuters (HSBC forecasts, July 9, 2026)
HSBC’s July 9, 2026 revision to its gold forecast made headlines because the bank cut its 2026 average prediction to $4,560 from $4,864, a $304 reduction. At the same time, the market price of gold was hovering near $4,000, roughly 28% below its January all-time high of $5,589.38. That decline understandably alarmed traders and commentators.
Yet HSBC left its year-end target unchanged at $4,750, and the bank did not alter its central bank demand forecast for 2026. It also kept longer-term year-end targets for 2027–2029 intact. That juxtaposition — a lower 2026 average but an unchanged year-end target — is the subtle but meaningful signal the market overlooked.
Why Do Rising Treasury Yields Push Gold Lower?
The short answer: gold yields nothing. When US Treasury yields and real yields rise, cash and bond returns look more attractive relative to non-yielding assets like gold. As of late July 2026, 10‑year US Treasury yields were meaningfully higher than earlier in the year and inflation expectations remained around mid-single digits, producing positive real yields that weigh on gold’s appeal.
A stronger US dollar compounds the effect. Higher US rate expectations attract global capital into dollar assets, strengthening the currency and making dollar-priced gold more expensive for overseas buyers. This combination suppresses demand and contributes to near‑term price pressure.
HSBC acknowledges these headwinds and views them as largely cyclical. The bank expects gold to trade within a $3,800–$4,700 range for the remainder of 2026 and sees that range as a floor rather than a path to deeper declines. Historical precedent supports this view: in 2022, gold held above $1,800 even through an aggressive tightening cycle, in part because central bank buying absorbed institutional selling.
The Knowledge That Changes Everything

Two essential guides — yours free. Understand why gold matters and why fiat currencies always fail.
Why Are Central Banks Still Buying Gold at These Prices?
The more important narrative is not who is selling, but who continues to buy. Central banks purchased a net 244 tonnes of gold in Q1 2026, outpacing the prior quarter and the five‑year quarterly average. Sovereign buyers are accumulating even as prices reach historic highs, suggesting multi‑year strategic reserve diversification rather than short-term trading.
Surveys indicate a large share of central banks plan to increase gold reserves in the coming year. These institutions manage national currency stability; their accumulation is a long-term allocation against systemic monetary risk, not a speculative trade. HSBC did not lower its central bank demand forecast when it cut the 2026 average, maintaining a forecast that implies continued sovereign absorption of supply.
At the same time, Asian retail demand has been strong. China led global gold ETF inflows in the first half of 2026, and Asian funds accounted for the dominant share of net global ETF inflows despite outflows elsewhere. As physical gold moves from Western exchange vaults into domestic reserves and retail hands across Asia, the supply available to the paper market tightens, amplifying any future re‑pricing when sentiment shifts.
What Does HSBC’s $4,750 Year-End Target Actually Tell You?
HSBC’s unchanged year-end target matters more to long-term holders than the lowered annual average. For those focused on multi-year preservation of purchasing power, the year‑end view signals that the bank expects structural supports to reassert themselves and lift the market into year‑end.
HSBC highlighted potential drivers of a second‑half recovery, including a partial reversal of heavy ETF liquidations and persistent fiscal deficits and sovereign debt pressures that support demand for safe, non‑dollar reserve assets. The bank also described recent geopolitical-driven declines as temporary and argued the pullback may present a positioning opportunity rather than evidence of structural failure.
In short: HSBC sees the path as temporarily harder but the direction unchanged. That distinction is crucial for investors who hold physical metal as a multi‑year hedge rather than as a short-term trading instrument.
Why Is the Gold-Silver Ratio at 70:1 a Signal, Not a Warning?
Silver has underperformed sharply during the correction. The gold-silver ratio rose from around 55:1 in May 2026 to roughly 70:1, a meaningful divergence. Silver’s demand profile blends monetary and industrial needs: roughly 58% of silver demand is industrial, tied to solar panels, electric vehicles, electronics and other sectors. When growth expectations weaken, silver faces pressure from both higher yields and slowing industrial demand.
Despite the cyclical weakness, silver faces a structural supply shortage. Forecasts point to consecutive annual deficits, with cumulative drawdowns in above‑ground stocks since 2021 amounting to hundreds of millions of ounces. Historically, elevated gold‑silver ratios have signaled relative silver undervaluation; when monetary conditions ease and industrial activity recovers, that ratio tends to compress.
Therefore, the elevated ratio is a signal of cyclical dislocation compounded by a persistent supply shortfall — not proof that silver’s long-term case has failed. Timing remains the primary uncertainty.
What Should a Long-Term Stacker Do Right Now?
Strategy should follow horizon. Short-term traders focused on immediate macro events and Fed communication need to manage timing risk explicitly. But for a long-term physical metals holder aiming to protect purchasing power over several years, current price weakness can present an accumulation opportunity.
Dollar-cost averaging through a consolidation phase reduces timing risk and allows gradual accumulation while paper markets work through liquidation cycles. The underlying structural factors that propelled gold to record levels — persistent central bank buying, rising sovereign debt burdens, and geopolitical fragmentation — remain in place. Real yields may be elevated now, but fiscal realities constrain how much and how long rates can rise without broader consequences.
HSBC itself notes that portfolio diversification demand, central bank buying and steady ETF inflows should support gold over the medium term. For investors who understand why they hold physical metal, the present correction is a reminder to stay the course rather than a reason to change a long-term plan.
Stay On Top of Gold & Silver Prices
Get important market alerts sent straight to your inbox.
People Also Ask
HSBC revised its 2026 average gold forecast to $4,560 per ounce but kept the year-end target at $4,750. The bank expects gold to trade in a range roughly between $3,800 and $4,700 for the rest of 2026 before moving toward the year-end target, while longer-term targets for 2027–2029 remain unchanged.
Short-term pressure comes from elevated US real yields and a stronger dollar, which raise the opportunity cost of holding non-yielding gold and make dollar-priced metal more expensive for overseas buyers. Central bank buying continues to provide a structural price floor, absorbing institutional selling and supporting medium-term fundamentals.
A ratio around 70:1 is above the long-term average and has historically indicated relative silver undervaluation. Given ongoing supply deficits and industrial demand fundamentals, an eventual compression of the ratio is plausible, but precise timing depends on monetary policy and industrial activity recovery.
That depends on your investment horizon. For long-term investors focused on purchasing power over 3–5 years, corrections often provide attractive entry points. Dollar-cost averaging is a practical approach to reduce timing risk. Short-term traders should weigh macro variables and Fed policy closely.
The Second Corner: What the Mainstream Is Missing
Mainstream commentary in mid-2026 framed gold’s correction as evidence that the bull run was over: the peak was in January, the Fed is hawkish, and the thesis is finished. That view misses the structural underpinnings that propelled gold from about $2,600 in late 2024 to its 2026 high.
Those drivers include sustained central bank purchases that set records in recent years and have remained well above historical averages, rapidly expanding sovereign debt levels that make prolonged tightening fiscally difficult, and an ongoing shift in reserve behavior among sovereigns. None of these structural factors were reversed by HSBC’s forecast revision or by short-term price action.
Near-term headwinds are real and cyclical. Structural drivers remain intact. Historically, when cyclical and structural forces reconcile, investors who accumulate physical metal during consolidation tend to secure superior long-term entries. HSBC’s unchanged year-end target is consistent with that interpretation rather than a repudiation of the long-term bull case.
SOURCES
Reuters reporting on HSBC, World Gold Council demand data, and industry surveys on silver supply and ETF flows.
Disclaimer: This article is for informational purposes only and does not constitute financial or investment advice. Consult a qualified financial adviser before making investment decisions.
You May Also Like:
- State Street Predicts $5,500 Gold by Q1 2027: Is the Dip Over?
- Why China’s Gold Buying Spree Outweighs India’s Pause
- What Is Purchasing Power — and Why Every Dollar You Save Is Slowly Being Taxed Away
- Why Hong Kong? Inside Offshore Gold Storage Networks
- Silver Price Outlook July 2026: Two Catalysts, One Setup
- Why the 10-5-3 Rule Fails Gold and Silver Investors
- Why Is Silver So Hard to Mine? The Primary Supply Problem Explained