How to Buy Gold for Less: 110 Live Prices Compared
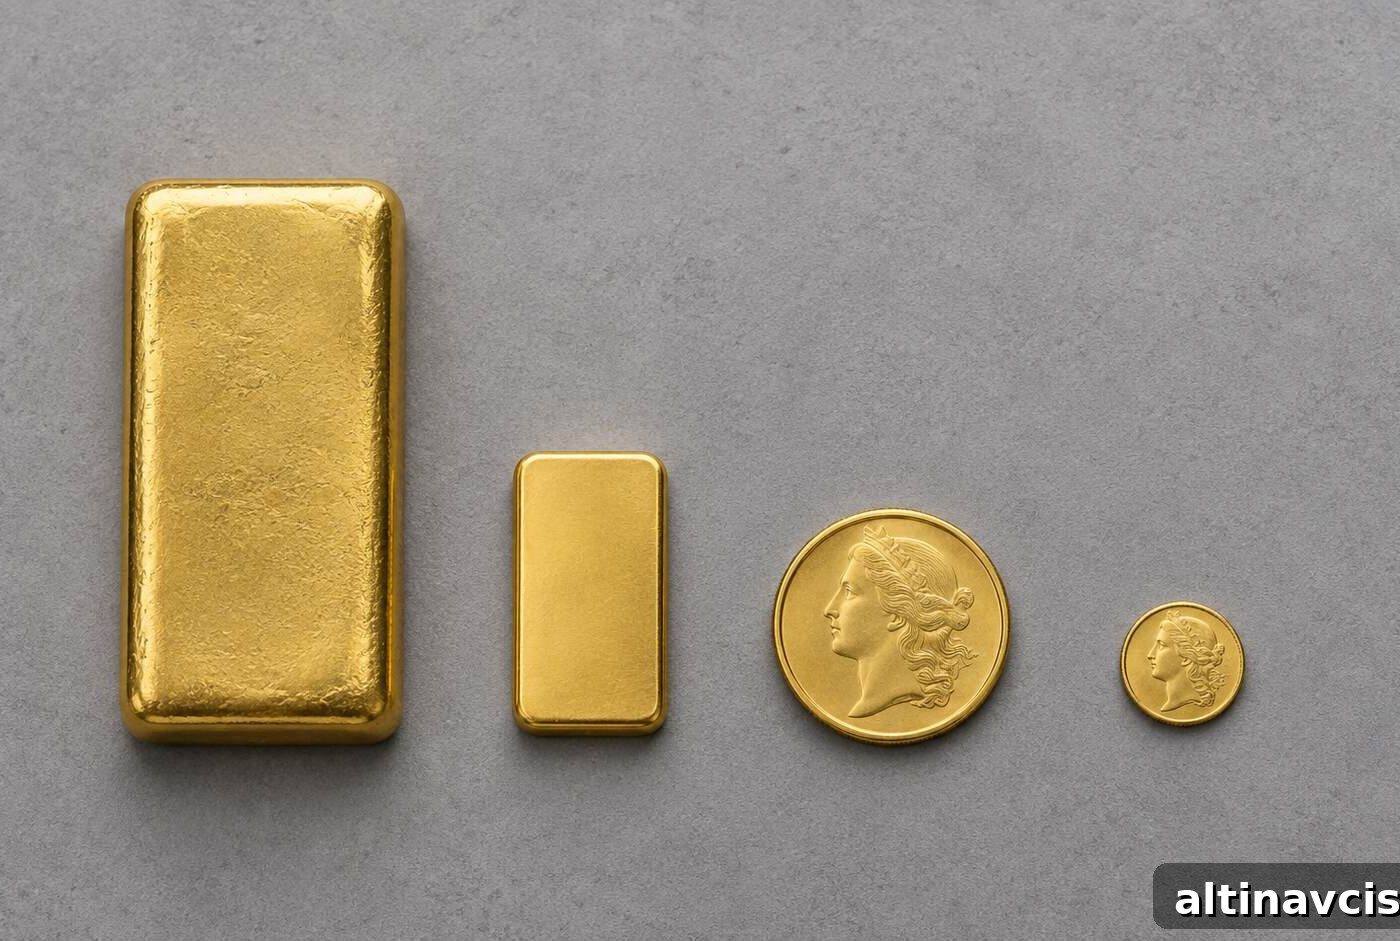
The cheapest way to buy physical gold is the format that gives you the most metal for every dollar you spend. That outcome is determined by the premium over the spot price, not the headline gold price itself.
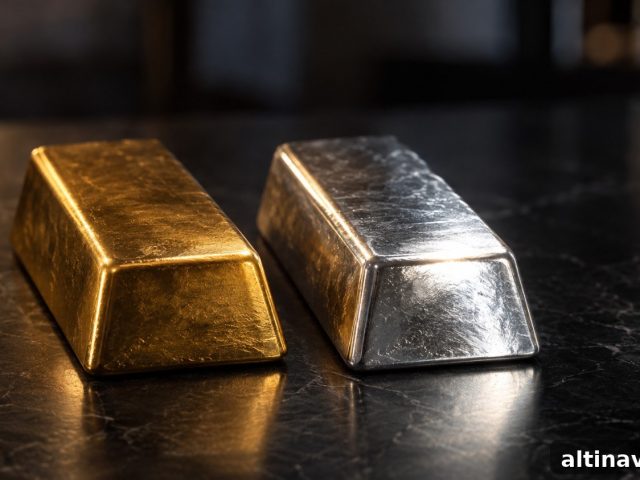
Direct answer: Larger formats are the most cost-efficient. GoldSilver surveyed 110 in-stock gold listings at major U.S. online bullion dealers on September 21, 2026. In that sample the median premium over spot for a 10 oz bar was 1.96%. By comparison, 1 oz bars were 2.99%, 1 oz sovereign coins 3.89%, and 1/10 oz coins 20.66%. In practical terms, a buyer who spends the same amount on tenth-ounce coins receives roughly 15.5% less gold than someone who buys 10 oz bars.
Key takeaways:
- Fractional sizes impose the largest controllable cost in retail gold. A median 20.66% premium for 1/10 oz coins means they cost more than ten times the extra percentage over spot compared with 10 oz bars.
- A tenth-ounce buyer receives about 15.5% less gold than a buyer of 10 oz bars spending the same amount. That gap is a ratio of premiums and holds at any spot price.
- On a $10,000 purchase the difference is meaningful. At the sample spot price of $4,346.51 per ounce, the shortfall equals roughly $1,520 in metal.
- Sovereign coins are unusually inexpensive right now. One-ounce government-struck coins showed a 3.89% median premium in this sample; historically they often trade in a 4%–8% band.
- One sovereign coin is cheaper than a generic bar. The South African Krugerrand posted a 2.49% median premium, below the 2.99% median for generic 1 oz bars in this survey.
What is a gold premium and why does it determine your cost?
The spot price is a wholesale benchmark for one troy ounce of gold, but dealers do not sell physical coins and bars at spot. Every physical product trades at a premium over spot to cover refining, minting, distribution, insurance and dealer margin.
Many of those expenses are fixed per item rather than per ounce: dies and minting setup, packaging, assay and handling often cost nearly the same whether the product is one-tenth of an ounce or one ounce. When the same fixed cost is spread over less metal, the premium percentage rises. That is why format—the size and type of the product—is the largest controllable cost for most retail buyers.
The Knowledge That Changes Everything

Two essential guides — yours free. Understand why gold matters and why fiat currencies repeatedly fail.
How much does each gold format cost over spot?
GoldSilver tracks retail listings continuously across major U.S. online bullion dealers. The figures below are market-wide observations captured on September 21, 2026, filtered for obvious anomalies. The reference spot price in the sample was $4,346.51 and remained consistent across the dataset, allowing valid comparisons between formats.
Premium over spot by gold product format, September 21, 2026. Median of 110 in-stock listings at major U.S. online bullion dealers.
| Format | Median premium | Observed range | Observations |
|---|---|---|---|
| 10 oz bar | 1.96% | 1.73% to 3.54% | 6 |
| 1 kg bar | 2.54% | 1.96% to 3.19% | 4 |
| 1 oz bar | 2.99% | 1.05% to 3.67% | 8 |
| 1 oz sovereign coin | 3.89% | 0.81% to 7.68% | 52 |
| 1/2 oz coin | 8.56% | 6.54% to 18.51% | 12 |
| 1/4 oz coin | 12.32% | 5.32% to 15.50% | 16 |
| 1/10 oz coin | 20.66% | 15.67% to 20.92% | 12 |
The premium curve becomes steep only at the smaller sizes. Shifting from 1/10 oz coins to 1 oz coins reduces the premium by nearly 17 percentage points, while moving from 1 oz bars to 10 oz bars saves only about one percentage point. The 10 oz and 1 kg figures come from relatively small samples (six and four observations), so they are reported with appropriate caution; both sit near the 2% level.
What does the premium cost you in ounces?
Percentages understate the real effect. Below is the same data expressed as ounces acquired for a $10,000 purchase at the sample spot price of $4,346.51, using the median premiums observed on September 21, 2026.
| Format | Ounces acquired | Metal given up vs 10 oz bar | Share of metal received |
|---|---|---|---|
| 10 oz bar (baseline) | 2.2565 oz | 0.000 oz | 100.0% |
| 1 kg bar | 2.2437 oz | 0.013 oz | 99.4% |
| 1 oz bar | 2.2339 oz | 0.023 oz | 99.0% |
| 1 oz sovereign coin | 2.2146 oz | 0.042 oz | 98.1% |
| 1/2 oz coin | 2.1193 oz | 0.137 oz | 93.9% |
| 1/4 oz coin | 2.0483 oz | 0.208 oz | 90.8% |
| 1/10 oz coin | 1.9068 oz | 0.350 oz | 84.5% |
Put simply: spending $10,000 on tenth-ounce coins on the sample date bought about 0.35 oz less gold than spending the same amount on 10 oz bars. At the spot reference of $4,346.51 per ounce, that difference equated to roughly $1,520 of metal.
Because the final column is a ratio of premiums, it does not depend on the absolute gold price. The 15.5% shortfall for tenth-ounce coins therefore holds whether gold trades at $2,000 or $5,000 per ounce.
Why are sovereign coins cheaper than usual right now?
This result was notable. One-ounce sovereign coins—American Gold Eagles, Canadian Maple Leafs, Krugerrands and similar government-struck issues—typically carry a 4%–8% premium because they buy global recognition and easier resale. In the September 21 sample, however, the median 1 oz sovereign premium was 3.89% across 52 observations, below the customary range and the largest sample in the dataset.
In the sample a generic 1 oz bar posted a 2.99% median premium while sovereigns averaged 3.89%, a gap of only 90 basis points. On a $10,000 purchase that narrow spread translates to about $84 in forgone metal for choosing the sovereign over a generic bar. As a result, the usual efficiency-versus-liquidity tradeoff between bars and coins is much closer than it commonly is.
Which sovereign coin carries the lowest premium?
The median conceals a wider spread among sovereigns. The seven sovereign coins tracked in the sample ranged across 393 basis points, so coin selection matters.
| 1 oz sovereign coin | Median premium | Observations |
|---|---|---|
| South African Krugerrand | 2.49% | 8 |
| Austrian Philharmonic | 3.34% | 8 |
| Canadian Gold Maple Leaf | 3.81% | 8 |
| Australian Kangaroo | 3.82% | 6 |
| Gold Britannia | 3.95% | 6 |
| American Gold Eagle | 4.52% | 8 |
| American Gold Buffalo | 6.42% | 8 |
The Krugerrand’s 2.49% median premium is presently lower than the 2.99% median for generic 1 oz bars, meaning this sovereign coin traded at a discount to unbranded metal in the sample. By contrast, the American Gold Buffalo at 6.42% sits well inside the customary band. Choosing one sovereign design over another can cost several percentage points of metal, so the question for buyers is often “which coin?” rather than simply “coin or bar?”
Does this mean fractional gold is a mistake?
Not necessarily. Fractional coins offer real benefits: they are divisible, easier to gift, simpler to move in small amounts and can better suit certain estate-planning needs. Those are valid reasons to pay a premium for convenience.
The problem arises when buyers choose fractional pieces because the piece price looks affordable without recognizing the percentage premium. If your goal is to maximize ounces for a given budget, larger formats are much more efficient. If you are buying fractional pieces for liquidity or practical uses, accept the tradeoff deliberately.
Why do premiums matter more when gold is expensive?
Premiums are a percentage of the price but translate to larger absolute dollars when spot is higher. For example, a 20.66% premium at $1,800 gold cost roughly $372 per ounce in extra premium; at $4,346.51 per ounce the same percentage costs about $898 per ounce. So the absolute penalty for choosing a high-premium format grows as the gold price rises.
Premiums are also a breakeven hurdle: metal bought at a high premium must rise by roughly that percentage before you break even on a resale at spot. Premiums paid at purchase represent metal you never acquired; no subsequent price move restores that lost metal.
How should you use these numbers?
Decide the role of the position before deciding the format. For a long-term core holding, favor the largest format you can comfortably store and sell; that maximizes metal per dollar. If you need divisibility, ease of gifting or fast resale, 1 oz sovereign coins are a reasonable compromise—especially when certain sovereigns are cheaper than generic bars.
Compare quoted premiums against the median figures shown above rather than against the headline gold price. Premiums move with mint output, dealer inventory and retail demand, so these numbers are a snapshot from September 21, 2026, not a permanent rate card.
Stay on Top of Gold & Silver Prices
Receive important market alerts straight to your inbox.
Sources
1. GoldSilver – Retail Premium Survey, 110 in-stock gold listings across major U.S. online bullion dealers (September 21, 2026).
2. GoldSilver – Live gold price chart (sample spot reference: September 21, 2026).
3. Federal Reserve Bank of St. Louis – 10-Year Treasury Inflation-Indexed Security, Constant Maturity (DFII10) (observed September 17, 2026).
4. Federal Reserve Bank of St. Louis – Market Yield on 10-Year Treasury Securities, Constant Maturity (DGS10) (observed September 17, 2026).
5. GoldSilver – Gold spot price vs premium explained (July 6, 2026).
Disclaimer: This article is for informational purposes only and does not constitute investment advice. Past performance is not indicative of future results. Consult a qualified financial advisor before making investment decisions.
You may also like:
- How Much Silver Should You Own? A Portfolio Allocation Guide by Age and Goal
- Who Owns US Debt? Central Banks Own Less Than You Think
- What Is Junk Silver? The Old Dimes and Quarters Worth Nearly 50x Their Face Value
- Why Is Silver Demand Tied to AI Data Centers?
- The Copper Mine That Isn’t Trying to Mine Silver Just Explained the Whole Deficit
- Inherited Gold IRA: Beneficiary Rules & the Step-Up Basis Gap
- The Cantillon Effect: Why Money Printing Makes Some People Rich First
Popular Topics
Picked from the archive
-
01
 Topics
What Investors Missed in Warsh’s Report When Gold Jumped $90
-
02
Topics
Why Gold Prices Are Falling Amid the Oil War
-
03
Topics
Silver Surges by a Third Over Gold Ahead of Fed Vote
-
04
Topics
China Moves Gold Reserves After 20-Month Buying Spree
-
05
Topics
Why Gold and Silver Are Rising: Five Reasons Experts Disagree
-
06
Topics
Why Silver Rose Despite JPMorgan’s Demand Warning
-
07
Topics
Why the IRS Requires a Depository for IRA Assets
-
08
Topics
Should You Still Hold Gold in Your Portfolio?