
Key Takeaways
- The Consumer Price Index (CPI) tracks average price changes for a fixed basket of goods and services and is published monthly by the Bureau of Labor Statistics (BLS). Three major methodological updates — Owners’ Equivalent Rent (1983), the geometric mean formula (1999), and hedonic quality adjustments — each tended to reduce the CPI’s reported rate.
- A 1996 advisory review known as the Boskin Commission concluded the CPI overstated inflation by roughly 1.1 percentage points per year. Subsequent BLS changes and a GAO follow-up reduced the estimated remaining bias to about 0.73–0.9 percentage points annually.
- The Federal Reserve frames its 2% inflation objective around the PCE price index, published by the Bureau of Economic Analysis (BEA), not the BLS CPI.
The Consumer Price Index is one of the most closely watched economic indicators. It influences financial markets, shapes Federal Reserve policy, and determines cost-of-living adjustments for programs like Social Security. But the CPI in use today is not identical to the index first developed in the mid-20th century. Over time, the BLS has changed measurement practices in ways that alter what the index captures. Three particularly important methodological updates have each reduced the CPI reading relative to what older methods would have reported.
What Is the CPI?
The Consumer Price Index for All Urban Consumers (CPI-U) measures the weighted average change in prices paid by urban consumers for a representative basket of goods and services. The BLS publishes it monthly. The CPI-U covers roughly 93% of the U.S. population and breaks spending into major categories such as food, housing, apparel, transportation, medical care, recreation, education and communication, and other goods and services.
Housing is the largest single component, with shelter making up over a third of the index. Food and beverages are another significant category. The CPI-W subset, which tracks urban wage earners and clerical workers, is the measure used to set Social Security cost-of-living adjustments.
The Knowledge That Changes Everything

Two concise guides — free. Learn why gold has long been a store of value and the risks that accompany fiat currency systems.
How Is the CPI Calculated?
The BLS compiles the CPI through a structured two-stage process. Field staff collect tens of thousands of price quotes each month across dozens of metropolitan areas. Those prices feed into detailed elementary indexes, which the BLS aggregates using expenditure weights derived from household surveys. Since 2023, the BLS has updated those spending weights annually, which more quickly reflects changing consumer behavior. Decisions about which items to include, how to treat substitutions between goods, and how to adjust for quality changes all shape the final index.
Why Did the CPI Calculation Method Change?
Three methodological shifts stand out for their long-term impact: replacing direct measures of homeownership costs with Owners’ Equivalent Rent (OER), adopting a geometric mean formula to reflect consumer substitution, and applying hedonic adjustments to account for quality changes. Each of these moves tends to lower the CPI relative to older methods.
How Did the 1983 Housing Shift Change the CPI?
Until 1983, the CPI included direct measures of home purchase costs such as mortgage interest, property taxes, and insurance. That made the index sensitive to sharp mortgage-rate swings. Starting in 1983, the BLS substituted Owners’ Equivalent Rent — an estimate of what homeowners would pay to rent their homes — as the way to reflect housing costs. OER now represents a large portion of the CPI’s weight within shelter. Because OER is tied to rental market dynamics, it typically lags movements in home purchase prices, which can mute CPI readings when house prices climb rapidly.
What Was the 1999 Geometric Mean Formula Change?
In 1999 the BLS began using a geometric mean formula for many elementary price indexes to better account for substitution. A geometric mean assumes that when relative prices change, consumers shift toward relatively cheaper options. That approach reduces measured inflation compared with a fixed-quantity index that assumes consumers buy the same basket regardless of price changes. The BLS estimated the change trimmed the annual CPI rate by a modest but meaningful amount, and over time the effect compounds.
How Do Hedonic Quality Adjustments Affect CPI?
Hedonic adjustments allocate part of a price change to improvements in product quality. For example, if a laptop costs the same but has a faster processor and larger storage, hedonic methods attribute some of that value to quality gains rather than inflation. These adjustments are especially relevant in categories like electronics and appliances and generally reduce measured inflation for goods that improve rapidly over time.
What Did the Boskin Commission Find?
A 1996 advisory review led by economist Michael Boskin concluded the CPI then in use overstated inflation by around 1.1 percentage points per year. The commission pointed to substitution bias, outlet substitution, quality change, and the treatment of new products as key sources of upward bias. The BLS adopted several recommendations, and a subsequent Government Accountability Office review put remaining bias at a lower but still measurable level.
What Is the Difference Between CPI and PCE?
Though both measure consumer price changes, CPI and PCE differ in scope and construction. The CPI is produced by the BLS and uses a fixed consumer basket with periodically updated weights; PCE is produced by the BEA and reflects a broader measure of household consumption with more frequent weight updates. The Federal Reserve states its 2% inflation objective in PCE terms. Historically, PCE has tended to run slightly below CPI on average.
What Does CPI Have to Do With Gold?
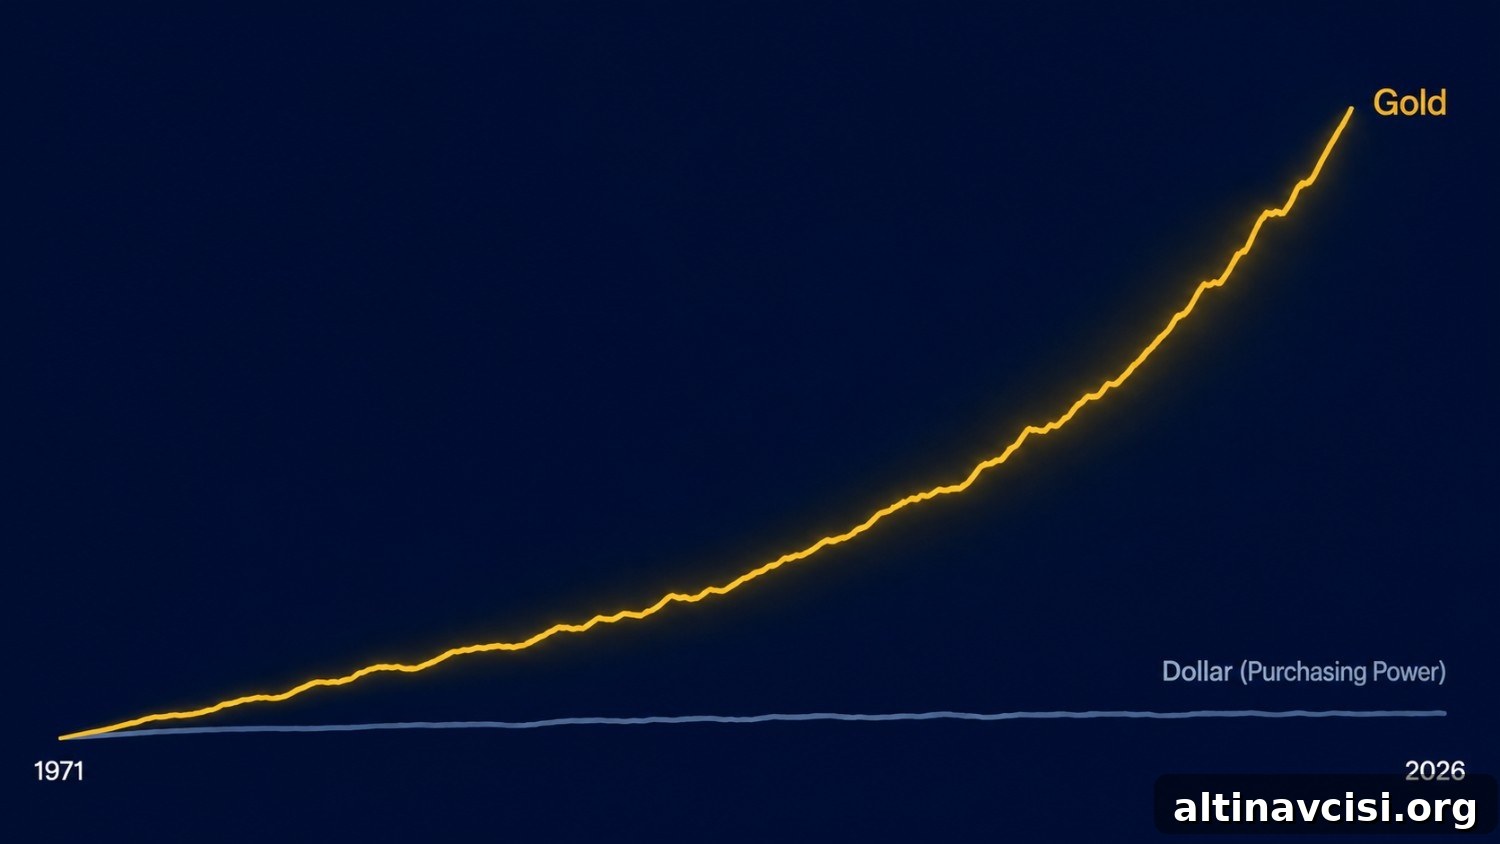
While gold is often cast as an inflation hedge, its price does not move in lockstep with CPI readings. Research shows only a portion of gold’s price swings align with CPI changes. Gold’s performance is more closely tied to real yields — nominal bond yields adjusted for inflation expectations. When real yields fall or become negative, the opportunity cost of holding non-yielding assets like gold declines, and gold often strengthens. Over long periods gold has preserved purchasing power well beyond what the CPI alone might suggest.
Stay On Top of Gold & Silver Prices
Get important market alerts sent straight to your inbox.
People Also Ask
What exactly does the Consumer Price Index measure?
The CPI measures average price change over time for urban consumers across a basket of goods and services. It is weighted by household spending shares and reflects relative changes in categories such as food, shelter, transportation, medical care, education and recreation. It measures price change rather than an absolute price level.
How is the CPI different from the PCE?
CPI and PCE differ in coverage and methodology. PCE, produced by the BEA, captures a broader set of consumption and updates weights more frequently; CPI, produced by the BLS, uses a specific consumer basket and publishes monthly. The Fed’s 2% goal is expressed in PCE terms, not CPI.
What did the Boskin Commission conclude?
The Boskin Commission concluded in 1996 that the CPI then in use overstated inflation by about 1.1 percentage points per year, due to substitution effects, outlet substitution, quality change, and new products. Later BLS reforms and a GAO review reduced the estimated residual bias but did not eliminate it.
How does CPI relate to gold prices?
Gold’s price movements are partially related to inflation but more directly influenced by real interest rates and broader monetary conditions. When inflation expectations push real yields negative, gold often rallies because the relative cost of holding non-yielding assets falls.
What is “core CPI”?
Core CPI excludes food and energy to strip out volatile components and reveal underlying inflation trends. Policymakers often watch core measures to assess persistent price pressures, though the Federal Reserve prefers core PCE as its primary indicator.
SOURCES
Bureau of Labor Statistics (BLS), Consumer Price Index; BLS publications on Owners’ Equivalent Rent, geometric mean implementation, and hedonic adjustments; Boskin Commission Final Report (1996); U.S. Government Accountability Office review; Bureau of Economic Analysis (BEA) on Personal Consumption Expenditures; Federal Reserve statements on goals and strategy; World Gold Council research on gold and inflation; LBMA historical gold price data.
Disclaimer: This article is for informational purposes only and does not constitute financial or investment advice. Consult a qualified financial adviser before making investment decisions.
You May Also Like:
- M2 Money Supply: The Number That Makes Your Portfolio Meaningless
- The Gold IRA Rollover Trap Most Investors Walk Straight Into
- The Canadian Gold Maple Leaf: Purer Than the Eagle, Lower Premium, and IRA-Eligible
- The Federal Reserve Has Eroded 97% of Your Dollar’s Value Since 1913. Here’s the Mechanism.
- Class 3 Vault: The Two-Hour Attack Standard That Protects Your Gold
- American Gold Eagle Coin: The Complete Investor Guide
- The Petrodollar System Explained: What It Is, How It Worked, and What’s Replacing It