How Real Yields, Not Nominal Rates, Move Gold Prices

Gold fell to $4,304 on September 23, 2026, while silver slid about 3% to $65. Many headlines attributed the move to hawkish comments from Federal Reserve officials and a firmer dollar—citing public remarks that day by St. Louis Fed President Alberto Musalem and Chicago Fed President Austan Goolsbee. Those statements mattered, but they weren’t the primary driver of gold’s move.
The key number was the 10‑year real yield, which jumped 13 basis points on the same day. If you don’t check that series yourself, you’re relying on secondhand narratives that can miss what actually moves the metal. Below is a clear, practical guide to the indicators that matter for gold price action and how to verify them yourself using public data.
Key Takeaways:
- Gold’s most consistent macro driver is the real 10‑year Treasury yield (FRED ticker DFII10), not the nominal 10‑year yield or the Fed funds rate.
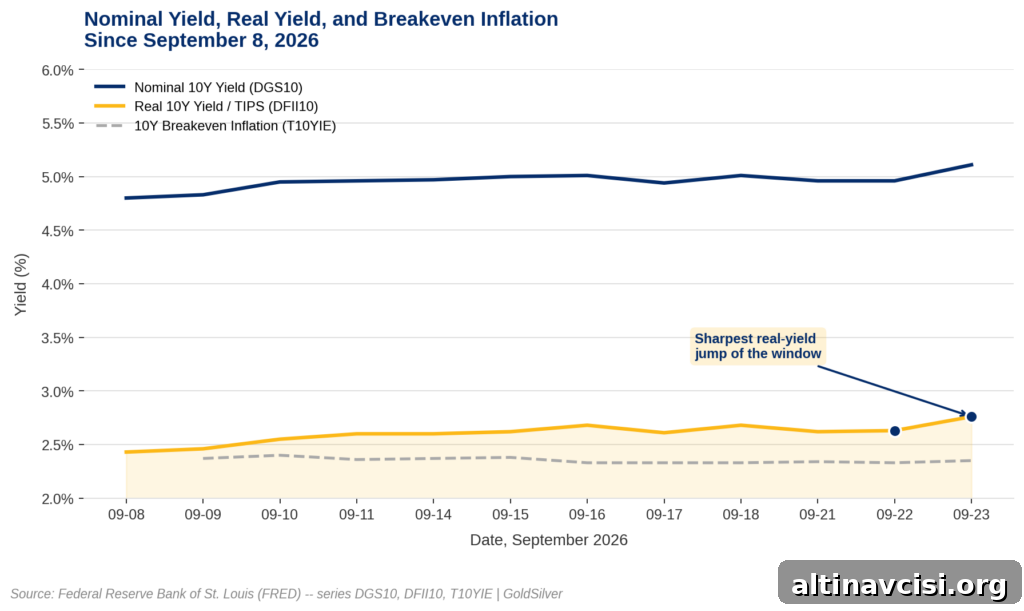
- Between September 8 and September 23, 2026, nominal 10‑year yields rose by 31 basis points while real yields rose 33 basis points and the 10‑year breakeven inflation rate stayed essentially flat. This month’s move is a real‑rate story, not an inflation story.
- Real yields were positive and climbing (2.76% on September 23, 2026), creating a distinct headwind to gold compared with the negative‑real‑yield environment of 2020–2022.
- All three series—DGS10 (nominal 10‑year), DFII10 (real 10‑year), and T10YIE (10‑year breakeven inflation)—are freely available on the Federal Reserve Bank of St. Louis’s FRED database and are updated daily. Any reader can check them directly.
What’s the Difference Between the Nominal and Real 10‑Year Yield?
There are two different 10‑year Treasury yields that matter for markets: the nominal 10‑year yield and the real 10‑year yield. They measure different things and lead to different implications for gold.
The nominal 10‑year yield (FRED: DGS10) is the yield you see quoted in headlines. It is the interest rate on a conventional 10‑year Treasury bond. On September 23, 2026, the nominal 10‑year closed near 5.11%, up 31 basis points from 4.80% on September 8.
The real 10‑year yield (FRED: DFII10) is the yield on Treasury Inflation‑Protected Securities (TIPS). Because TIPS adjust principal with inflation, the DFII10 number isolates the compensation investors receive purely for lending money, after removing the inflation premium. On September 23, DFII10 closed at 2.76%, up 33 basis points from 2.43% on September 8.
The difference between the nominal and the real yield—about 2.35 percentage points in this window—is the market’s breakeven inflation rate (FRED: T10YIE), an estimate of expected average inflation over the next decade. In mid‑September that breakeven barely moved, drifting from about 2.37% to 2.35%.
Put plainly: nominal yields rose roughly as much as real yields, while inflation expectations stayed flat. That means almost the entire move in yields was a rise in real rates, not a change in inflation expectations. And gold responds much more directly to real yields than to nominal yields.
Why Do Real Yields Move Gold More Than the Fed Funds Rate?
Gold pays no interest or dividend. Its opportunity cost is the return investors could get from a safe, interest‑bearing asset. That opportunity cost is measured in real terms—after inflation—because inflation reduces purchasing power regardless of whether returns are paid as coupons or held as cash.
When real yields rise, the cost of holding a zero‑yield asset like gold increases and gold typically comes under pressure. When real yields fall or turn negative, a nominally “safe” bond can guarantee a loss of purchasing power, making gold relatively more attractive. That transmission mechanism—real yields versus gold—is more direct and consistent than the relationship between gold and the Fed funds rate, which is a short‑term policy tool that affects long yields only indirectly.
The recent data illustrate this cleanly. The largest single‑day rise in DFII10 in the September window occurred between September 22 and 23, when DFII10 jumped from 2.63% to 2.76%. That same trading day saw one of gold’s sharpest recent single‑day declines, a drop of about 1.6% from $4,358.58 to $4,287.43—consistent with real yields driving the move.
The Knowledge That Changes Everything

Two essential guides — yours free. Understand why gold matters and why fiat currencies always fail.
Are We in a Negative or Positive Real‑Yield Regime Right Now?
Real yields at 2.76% are solidly positive. This is not the negative‑real‑yield, financial‑repression environment of 2020–2022, when “safe” bonds effectively guaranteed a loss of purchasing power and gold’s case was simpler. Today’s positive, rising real yields are a genuine headwind for gold, and the fact that gold has held up as well as it has this year is notable.
The important analytical point is the same in any regime: decomposing moves in nominal yields into real yields and breakeven inflation tells you which force—real rates or inflation expectations—is driving metal prices.
A recent example: silver briefly reversed a 6.8% swing over nine days in mid‑September. Many coverage pieces credited fading inflation fears, but the market data showed breakevens were flat or falling while real yields rose by about 22 basis points—again pointing to real yields as the driver.
Why Is Social Media Still Blaming Inflation, Not Real Yields?
Online sentiment about gold often centers on inflation narratives because inflation is an easier story to tell and measure for many retail traders. At the time of the September move, social sentiment on gold was heavily positive and many traders attributed strength to CPI‑centric themes. But the trade‑weighted dollar index was strengthening and breakeven inflation was effectively unchanged—signs that the crowd was focusing on the wrong half of the yield equation.
It’s an understandable blind spot: nominal and real 10‑year yields can look similar at a glance. The simple three‑series check below helps avoid that mistake.
How Can You Check Real Yields Yourself?
You don’t need a paid terminal to do this. The Federal Reserve Bank of St. Louis’s FRED database publishes all three relevant series for free and updates them daily. On FRED, search these tickers:
- DGS10 — Nominal 10‑Year Treasury Constant Maturity Rate
- DFII10 — 10‑Year Treasury Inflation‑Indexed Security, Constant Maturity (real yield)
- T10YIE — 10‑Year Breakeven Inflation Rate
Pull the last two to three weeks of daily data for each series and compare them. If DGS10 and DFII10 move together while T10YIE remains flat, the move is a real‑rate story and typically a headwind for gold when rates rise. If T10YIE moves while DFII10 is steady, the move reflects changing inflation expectations and gold’s response can be supportive but less consistent.
Stay On Top of Gold & Silver Prices
Get important market alerts sent straight to your inbox.
People Also Asked
What is the difference between a real yield and a nominal yield?
A nominal yield is the interest rate printed on a bond and does not adjust for inflation. A real yield removes the expected inflation component and measures the purchasing‑power return to the lender. On U.S. Treasuries, the nominal 10‑year is DGS10 and the real 10‑year (TIPS yield) is DFII10. The difference between them is the market’s breakeven inflation rate, T10YIE.
Should investors watch real yields or nominal yields when following gold?
Watch real yields. Nominal yields combine real returns and inflation expectations; only the real component consistently moves gold. In the September 2026 example, both nominal and real yields rose, while breakeven inflation stayed flat—an outcome that points squarely to real yields as the driver.
How do I check real yields myself, step by step?
Visit the FRED website and pull DGS10, DFII10, and T10YIE for the most recent daily data. Compare the last two to three weeks. If DGS10 and DFII10 move together while T10YIE is steady, real yields are influencing the market. If T10YIE moves and DFII10 does not, inflation expectations are the likely factor.
What happens to gold if real yields keep rising?
Rising real yields increase the opportunity cost of holding gold, which tends to be a headwind for prices. Historically, a 25‑basis‑point rise in real yields has often corresponded with a notable, though not mechanically exact, downward move in the gold price. Other forces—central bank purchases, dollar moves, or geopolitical demand—can offset that effect in the short term.
What happens if breakeven inflation starts rising instead of real yields?
If breakeven inflation (T10YIE) rises while DFII10 stays steady, the story shifts to inflation expectations. Rising inflation expectations have historically supported gold, though the relationship is less immediate and less consistent than the real‑rate linkage. The same three‑series check will reveal that shift.
Why does gold react to real yields instead of the Fed funds rate?
The Fed funds rate is a short‑term policy lever. Its influence on gold works mainly by altering longer‑term real yields. The market’s real 10‑year yield is the more direct and reliable variable for gold because it defines the inflation‑adjusted opportunity cost of holding a zero‑yield asset.
SOURCES
1. Federal Reserve Bank of St. Louis (FRED) — DGS10 (10‑Year Treasury Constant Maturity Rate).
2. Federal Reserve Bank of St. Louis (FRED) — DFII10 (10‑Year TIPS Constant Maturity, real yield).
3. Federal Reserve Bank of St. Louis (FRED) — T10YIE (10‑Year Breakeven Inflation Rate).
4. Gold and silver live price charts and intraday data from market providers used for price references.
5. Public comments by Federal Reserve officials on September 23, 2026, cited in market coverage at the time.
Disclaimer: This article is informational only and is not investment advice. Past performance does not guarantee future results. Consult a qualified financial advisor before making investment decisions.
You May Also Like:
- How to Read a Gold Spot Price Chart: The 4 Things That Actually Matter
- Central Banks Hold 80% of Reserves in Gold. Sovereign Wealth Funds Hold Under 1%.
- You Don’t Need to Take Delivery to Sell Your Gold. Here’s What Actually Happens.
- The Real Price of a 1 Gram Gold Bar Isn’t $140
- What Are Negative Real Interest Rates, and Why Does Gold Thrive in This Environment?
- Cheapest Way to Buy Gold? We Measured 110 Live Prices
- How Much Silver Should You Own? A Portfolio Allocation Guide by Age and Goal
- Who Owns US Debt? Central Banks Own Less Than You Think
Popular Topics
Picked from the archive
-
01
 Topics
PMI Beat Moves Gold Price Two Ways: Markets Priced Only One
-
02
Topics
France Completes Gold Repatriation, Germany Set to Follow
-
03
Topics
Jobs Beat, Ceasefire, Deficit: Impact on Gold Prices
-
04
Topics
Federal Reserve Votes Wednesday: Track the Vote Tally
-
05
Topics
Peak Gold: Why Gold Mine Output Can’t Meet Demand
-
06
Topics
Why Gold Climbed After an 8% Oil Spike — What’s Different
-
07
Topics
Gold Prices Stabilize Amid Saudi-Iran Tensions
-
08
Topics
Gold vs Stocks and Bonds: Investment Data Explained