Gold-to-Copper Ratio: Does It Predict Prices or Only Yields?

The gold-to-copper ratio is a simple division of gold’s price by copper’s price; traders often invert it to form the copper-to-gold ratio. Market participants use the copper-to-gold ratio as a barometer for economic growth and interest-rate expectations. For people who own gold, however, the critical question is whether this ratio actually predicts the future direction of gold prices. The evidence suggests the ratio provides insight into growth and Treasury yields, but it is not a reliable standalone forecast for gold’s next move.
Short answer: it mainly signals growth and yields, not gold. Academic and industry research links the copper-to-gold ratio to movements in the 10-year Treasury yield rather than directly to subsequent moves in the gold price. Because gold is part of the ratio (as the denominator), gold’s own price moves can change the ratio without offering predictive information. Investors should therefore treat the ratio as a gauge of macro conditions—particularly growth and real yields—and monitor real Treasury yields directly when evaluating gold.
Key takeaways
- Research largely tests the copper-to-gold metric against Treasury yields, not as a direct predictor of gold prices.
- Gold is the denominator in the ratio; moves in gold itself alter the ratio and can create misleading signals.
- During the September–November 2026 window, gold fell about 6.7% while the copper-to-gold ratio moved only modestly, illustrating how co-movements can mute the ratio’s signal.
- Recent distortions—such as tariff-driven stockpiling—have affected COMEX copper prices and complicated interpretation in 2026.
What Is the Gold-to-Copper Ratio, and How Do You Calculate It?
The commonly used copper-to-gold ratio is calculated by taking the COMEX copper price per pound, dividing it by the gold price per ounce, and multiplying the result by 1,000 to produce a more convenient number. This is simply the inverse of the gold-to-copper ratio. For example, when copper traded near its record highs and gold closed at a much higher level, the resulting ratio can appear low. Traders prefer the copper-to-gold presentation because it more directly reflects industrial demand relative to monetary demand.
The Knowledge That Changes Everything

Two essential guides — yours free. Understand why gold matters and why fiat currencies erode over time.
Why Does the Copper-to-Gold Ratio Track Treasury Yields?
Copper is primarily an industrial metal and tends to reflect economic growth. When growth expectations rise, yields on Treasury securities typically increase as investors price in stronger activity and potential inflation. Over several years, analysts have observed a meaningful correlation between the copper-to-gold ratio and the 10-year Treasury yield, though correlations vary over time. The ratio also reduces the dollar’s direct influence because it combines an industrial commodity with a monetary metal, which can make it a useful macro indicator—especially when markets are calm.
Does the Gold-to-Copper Ratio Predict Gold’s Next Move?
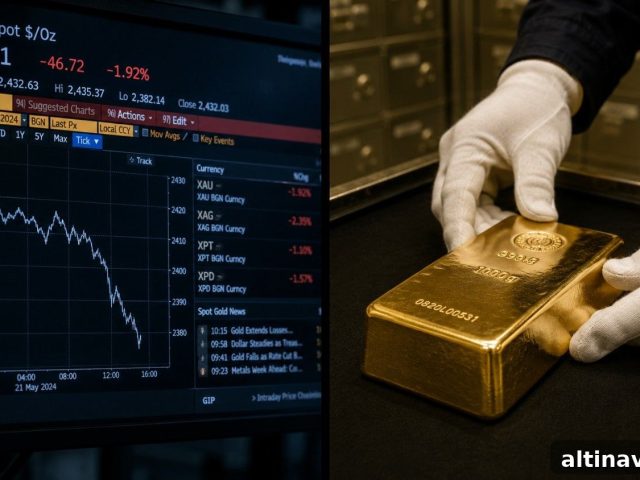
Published studies and empirical observations do not provide strong evidence that the ratio reliably forecasts gold prices. Arithmetic alone explains part of the issue: if copper and gold fall together due to a shared shock, the ratio may hardly change even while gold drops substantially. For instance, during a recent multi-week period when gold fell by roughly 6–7% and copper fell by a similar or larger percentage, the ratio moved only marginally. That co-movement demonstrates that the ratio can miss significant moves in gold when both metals respond to the same event.
For investors focused on gold, direct drivers such as real Treasury yields, the dollar’s trend, and market positioning are more informative. Real yields—nominal yields adjusted for inflation expectations—show a more direct historical relationship with gold, and those data are the better place to start when assessing likely gold performance.
Why Is the Signal Harder to Read in 2026?
In 2026, several supply- and policy-driven distortions affected copper markets. Elevated U.S. copper imports as traders front-loaded shipments ahead of tariff changes and unusually low inventories on some exchanges introduced non-demand price moves. These trade and policy headlines caused sudden swings in COMEX copper that were not tied to underlying global growth, complicating the ratio’s interpretation. At the same time, shifts in breakeven inflation and changes in real yields further influenced gold and Treasury dynamics, so reading the ratio without considering these forces can be misleading.
What Should Gold Owners Take From the Ratio?
Treat the copper-to-gold ratio primarily as a macro indicator that reflects growth expectations and, indirectly, interest-rate direction. Because gold is part of the ratio, its own price action can change the signal and generate ambiguous readings—especially when both metals move together. Commodity strategists caution that co-movement does not equal causation, so the ratio should not be used in isolation to time gold purchases.
If you own gold, prioritize tracking real yields, the dollar, and market positioning. These factors typically provide clearer guidance for gold’s outlook. For long-term investors, consider maintaining a consistent allocation rather than relying on short-term ratio signals to trade in and out of gold.
Stay On Top of Gold & Silver Prices
Get important market alerts sent straight to your inbox.
People Also Ask
What is the copper-to-gold ratio?
The copper-to-gold ratio divides copper’s price per pound by gold’s price per ounce (often multiplied by 1,000 for readability). Traders use it to compare industrial demand against safe-haven demand: a higher reading typically suggests stronger economic growth expectations, while a lower reading suggests caution. There is no clear peer-reviewed evidence that the ratio reliably predicts future gold prices.
How does the copper-to-gold ratio differ from the gold-silver ratio?
The gold-silver ratio compares two precious metals and shows how many ounces of silver equal one ounce of gold, providing insight into relative value within precious metals. The copper-to-gold ratio pairs an industrial metal with a monetary metal and therefore serves more as a gauge of growth expectations and interest-rate sentiment. Each ratio answers different investor questions and should not be used interchangeably.
How do I track the copper-to-gold ratio?
Use consistently timed price sources: COMEX copper in dollars per pound and spot gold in dollars per ounce. Divide copper by gold and multiply by 1,000 to get the copper-to-gold reading. Researchers recommend focusing on weekly changes rather than single-day moves because the ratio’s predictive signal, when present, tends to be short-lived.
Is the copper-to-gold ratio a reliable indicator?
It can be useful but is imperfect. The ratio works best in calm markets and during periods when copper reflects genuine demand shifts rather than trade or policy-driven distortions. False signals are more common around large macro shocks or when trade policies and inventory flows distort copper prices. Always confirm the ratio’s message with real yields and the dollar before making investment decisions.
Should gold owners use the ratio to time purchases?
No. There is no strong published evidence that the ratio forecasts gold reliably. Because gold’s price itself is part of the ratio, using the ratio as a timing tool is prone to misleading signals. Real yields, the dollar, and positioning data are more direct indicators for assessing gold. Long-term owners should consider a consistent allocation strategy and review it periodically instead of relying on short-term ratio signals.
What happens if the ratio and the 10-year yield diverge?
A divergence suggests that one market may be mispriced or that a specific shock has altered the usual relationship. When copper rallies or falls for reasons unrelated to broad growth—such as inventory squeezes or tariff moves—the ratio can decouple from yields. In those cases, wait for confirmation from real yields and currency moves before changing positions.
SOURCES
1. Bloomberg — coverage of copper-gold ratios and yield relationships.
2. North American Journal of Economics and Finance — academic analysis of the copper-to-gold ratio and the 10-year Treasury yield.
3. CFA Institute — discussion of the copper-gold ratio and its statistical properties.
4. FRED — U.S. Treasury 10-year nominal and inflation-indexed yields and breakeven inflation data.
5. Trading Economics — COMEX copper futures data.
6. GoldSilver price charts — gold and silver historical price data.
7. OilPrice.com — reporting on U.S. copper imports and LME inventory movements in 2026.
Disclaimer: This article is for informational purposes only and does not constitute investment advice. Past performance is not indicative of future results. Consult a qualified financial advisor before making investment decisions.
You May Also Like:
- Gold in Retirement: Can It Reduce Sequence Risk?
- Gold and Silver Outlook 2027: Forecasts and Risks
- Gold Vault Storage: Inside a Brink’s Vault
- What Backs the US Dollar Today?
- Silver Price Outlook October 2026: Fed Hold Is Locked
- Gold Price Outlook October 2026: Pullback & Fed Decision
- Long-Term Gold Ownership: The Case for Holding Gold
Popular Topics
Picked from the archive
-
01
 Topics
Should You Buy Gold Now During a Dip? Timing and Risks
-
02
Topics
Bank of America’s $6,000 Gold Forecast Signals a Systemic Shift
-
03
Topics
Gold Price Outlook Sept 2026: Fed’s Sept 15–16 Meeting Impact
-
04
Topics
Gold Needed One Catalyst to Break $4,400 – It Just Got Five
-
05
Topics
Gold Price Falls Today: Why $4,500 Holds as Support
-
06
Topics
Gold Drops as China Buys Most in 17 Months
-
07
Topics
Gold Risk-Reward Calculator: Is Your Portfolio Secure?
-
08
Topics
300 Billion Lesson: What Frozen Reserves Revealed About Gold