Gold Price Near 4,180 as GDP Upgrade Offsets Inflation Miss
On Wednesday, the U.S. Bureau of Economic Analysis released the Fed’s preferred inflation measure, and it came in softer than expected. Gold jumped on the data initially, but by Thursday morning the rally had been erased and then some. The reversal came down to a detail most outside trading desks missed: the same report also revised GDP higher, altering how markets priced the Federal Reserve’s next move.
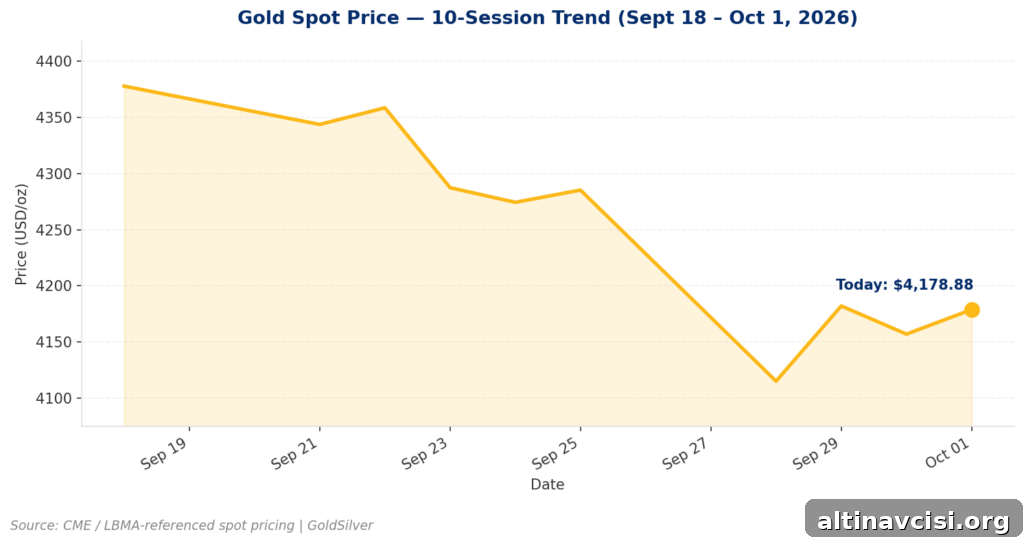
This morning gold is trading near $4,178.88 an ounce, a partial recovery after the week’s volatility. The metal briefly spiked toward $4,220 on Wednesday after the inflation figures hit, then reversed sharply to about $4,139 during Thursday’s Asian session before stabilizing. Silver is holding near $61.13, essentially flat for the week. Both metals are digesting one report that pushed the Fed outlook in two opposite directions.
Why Did a Softer Inflation Print Fail to Keep Gold’s Rally Going?
The BEA reported that core PCE—personal consumption expenditures excluding food and energy, the Fed’s favorite inflation gauge—rose 3.0% year-over-year in August. That matched a downward revision to July and missed the 3.3% consensus. Headline PCE rose 3.4% versus a 3.7% forecast. A weaker-than-expected inflation reading ordinarily supports gold, since lower inflation reduces the opportunity cost of owning a metal that yields nothing. That mechanics explains the immediate spike toward $4,220.
However, the same 8:30 a.m. release also revised second-quarter GDP growth upward, from a 1.5% annualized pace to 2.2%. That growth revision shifted the narrative. As Societe Generale economist Jan Groen noted, the inflation revisions were “modestly favorable,” but the stronger growth read mattered more for markets. In short, the economy entered the second half of 2026 with more momentum than traders had priced in, and that momentum pushed yields higher and pressured gold.
The interaction is straightforward. A softer inflation surprise increases the odds the Fed pauses or eases later, lowering real yields—the return on cash after inflation—and supporting gold. An upside surprise on growth does the opposite: it suggests the economy can tolerate tighter policy, keeping the possibility of higher rates on the table. Because both signals arrived in the same report, growth ultimately dominated and the gold spike gave back its gains.
The Edge Every Investor NeedsSmarter precious metals investing starts with clear, timely insight. Our newsletter delivers market context, Fed updates, and practical ideas so investors can make better decisions.
What Is the Fed Actually Pricing Right Now?
Markets reacted quickly. CME Group’s FedWatch tool showed the probability of an October rate hike falling from roughly 51% the session before to about 38% after the report was absorbed. Goldman Sachs moved its forecast for the Fed’s next hike from October to December the same day, citing the softer inflation print. That did not eliminate the prospect of higher rates this year; traders simply pushed expected tightening further out. FedWatch still implied better than an 85% cumulative probability of at least one hike by year-end as markets priced a December tightening instead of October.
This dynamic is central for anyone following gold. The metal’s price is highly sensitive to real yields—the gap between nominal interest rates and expected inflation. When that gap narrows, owning non-yielding assets becomes less costly and gold tends to rise. When real yields widen, the opportunity cost of holding gold increases and prices can fall. The PCE-GDP combo pushed that real-yield channel, and growth expectations tilted the balance away from gold.
What’s the Real Story Behind This Week’s Price Action?
The deeper takeaway is that growth data, not inflation alone, is now the decisive swing factor. In 2022 and 2023, hot CPI prints often moved gold on their own. Today the story has shifted: stronger growth readings increase the chance of further Fed tightening and put downward pressure on precious metals. That means a weak patch in growth indicators, rather than a single soft CPI release, would more reliably stabilize or lift gold from here.
Silver is tracking the same mechanism. Its larger pullback in September reflected sensitivity to real yields and industrial-demand expectations. Both metals are now reacting more to the expected path of interest rates than to safe-haven narratives that occasionally surface in headlines. For context, geopolitical tensions—such as the unresolved U.S.-Iran standoff—have added a modest dollar impact in recent weeks, but that background factor predates this report and was not the driver of Wednesday’s moves. The growth-versus-inflation trade-off dominated.
What Should Investors Watch Next?
Investors have a busy economic calendar ahead. Weekly initial jobless claims will be released at 8:30 a.m. Eastern, followed by the final September Manufacturing PMI at 9:45 a.m. Fed Governor Christopher Waller is scheduled to speak and the ISM Manufacturing PMI arrives at 10 a.m. The employment picture culminates with September’s nonfarm payrolls report on Friday. Over the next several days, the critical question for markets is not just whether inflation runs hot or cold, but whether growth continues to surprise on the upside.
For now, gold trading near $4,178.88 reflects a market that remains undecided. Traders have shifted a potential October hike into December, but the path of growth data between now and then will determine whether that expectation holds, or whether the Fed’s timing changes again. Investors should track real-yield moves and incoming growth indicators closely to gauge the metals market’s next leg.
SOURCES
1. U.S. Bureau of Economic Analysis, Personal Consumption Expenditures Price Index release (core and headline, August 2026 data).
2. U.S. Bureau of Economic Analysis, Q2 2026 GDP revision (1.5% to 2.2% annualized).
3. Societe Generale (Jan Groen), client research note on August PCE and Q2 GDP revisions.
4. CME Group, FedWatch Tool; Goldman Sachs public forecast commentary on Fed timing.
Disclaimer: This article is for informational purposes only and does not constitute investment advice. Past performance is not indicative of future results. Consult a qualified financial advisor before making investment decisions.
You May Also Like:
- BlackRock Called It a Supercycle Today. The Mines and Vaults Already Agree.
- Gold Jumps as Core PCE Cools More Than Expected, Overshadowing the ADP Jobs Beat
- Job Openings Missed Today. That’s Exactly Why Gold Caught a Bid.
- Gold Fell Again. Five Wall Street Desks Can’t Agree on Why.
- Gold Just Hit a Two-Month Low. Yields, Not Iran, Are Why.
- Gold’s 7-Week Low: What the Chart Says Happens Next
- Gold Sank 4% Today. Five Other Signals Point to a Steadier Market Underneath.
- Gold Fields’ $27 Billion Bid Got Rejected. The Reason Is a Risk Bullion Doesn’t Carry.
- Gold Falls 3% as Hormuz Standoff Lifts Fed Hike Odds to 66%
Popular Topics
Picked from the archive
-
01
 Topics
Why Investors Choose the Vienna Philharmonic Gold Coin
-
02
Topics
Stablecoin Issuer Outspent Central Banks on Gold Last Year
-
03
Topics
Why Gold Prices Are Falling Amid the Oil War
-
04
Topics
How to Buy Gold in 2026: Step-by-Step Guide for Beginners
-
05
Topics
Silver Appears Weak, Silver-to-Gold Ratio Signals Accumulation
-
06
Topics
Why Gold Prices Are Falling: What Most Investors Get Wrong
-
07
Topics
Should You Still Hold Gold in Your Portfolio?
-
08
Topics
Gold Bars vs Jewelry: Why Investors Choose Bullion