First Notice Day: How Six Paper Claims Back One Ounce of Silver

Silver is trading near $69.20 an ounce today, close to its highest levels since May. The more important development this week is not the spot price itself but the activity inside COMEX’s delivery system as September’s silver futures approach First Notice Day.

The Edge Every Investor Needs
Smarter precious metals investing starts here. The Nuggets Newsletter delivers market insights, Fed updates, global trends, and educational videos to help you make better decisions.
What Is First Notice Day, and Why Does It Matter for Silver?
First Notice Day is the deadline by which futures holders must choose to close their position, roll it into a later month, or accept physical delivery. Each COMEX silver contract represents a claim on 5,000 troy ounces. Most traders use futures for price exposure and never intend to take delivery, but a subset of holders will stand for delivery, turning a paper claim into a request for actual silver.
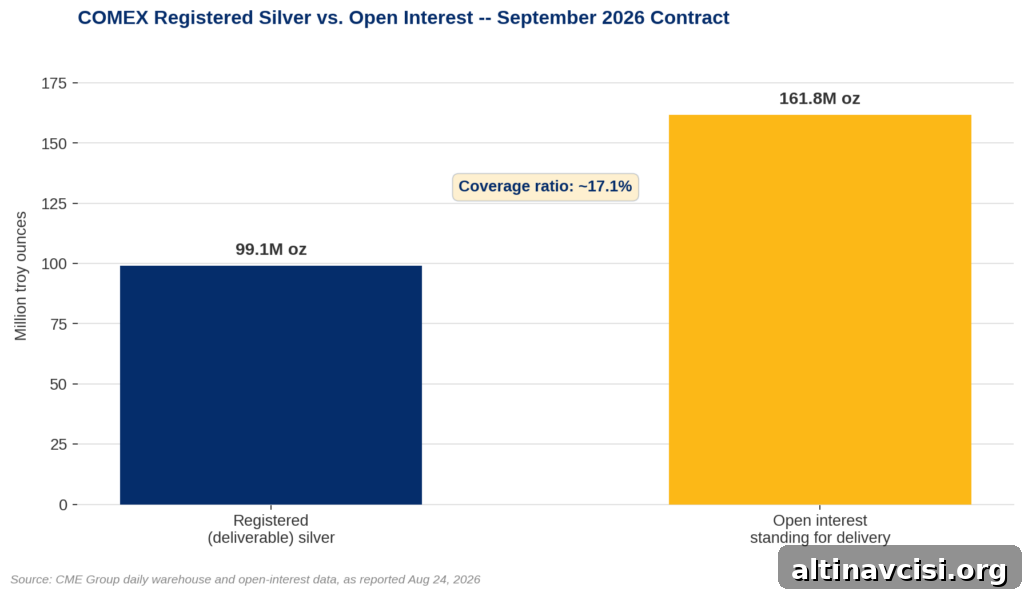
As of the most recent CME Group reporting window, the September 2026 contract still showed 32,363 open contracts. That equals 161.8 million ounces standing against about 99.1 million ounces of registered, deliverable silver in COMEX-approved warehouses. That imbalance—the amount of paper claims versus immediately deliverable metal—is the key story this week.
How Much Deliverable Silver Does COMEX Actually Have?
COMEX warehouses classify silver as either “registered” or “eligible.” Registered silver carries an active warehouse warrant and can be delivered immediately. Eligible silver meets the exchange’s standards and sits in the same vaults, but its owner has not warranted it for delivery.
According to the latest CME Group warehouse report, registered stocks were about 99.1 million ounces, while another 238.7 million ounces were listed as eligible but not warranted. Dividing open interest by registered inventory produces the coverage ratio — a simple but meaningful measure of how much of the paper market the available deliverable stock could satisfy. At roughly 17.1% today, the ratio is tight by historical norms, though not entirely unprecedented.
For context, the coverage ratio around April’s First Notice Day was closer to 13–14%, so the ratio has loosened slightly since spring even as open interest in the delivery month declined sharply (from 81,726 contracts on July 24 to 32,363 in the most recent window). That fall in open interest is normal: most speculators roll positions before delivery, so a shrinking count is expected and not, on its own, a sign of distress. What matters is how many contracts remain relative to the registered metal behind them.
Why Does the Coverage Ratio Matter If Most Contracts Never Stand for Delivery?
The coverage ratio describes the plumbing of the futures-to-physical system; it is not a forecast. A futures contract is a legal claim on silver, while registered inventory is the physical pool the exchange can hand over if enough holders demand delivery. The ratio simply shows how much of the paper market could be converted to metal at once.
Historically, COMEX has met delivery obligations. One reason is logistical: a depository receipt for specific vaulted bars can change hands multiple times in a single delivery month without reducing registered inventory. A long position can stand for delivery, obtain the receipt, and then the same metal can be redelivered by another party, leaving the registered total unchanged. That mechanism means headline delivery volume can overstate the real draw on registered stock.
Still, the structural fact remains: when paper claims outnumber deliverable metal by several times, the difference between owning a claim and owning the metal is tangible. The coverage ratio highlights that structural gap and is therefore a useful metric for anyone considering the relative merits of paper exposure versus holding physical silver.
What Does This Mean for Someone Deciding Between Paper and Physical Silver?
An ETF share or a futures contract gives you price exposure, not a bar sitting in your name that you can demand on short notice. Only the relatively few market participants who stand for delivery successfully receive metal each month. The coverage ratio is a real-time illustration of how much of the paper market could be converted to physical silver immediately, and that gap matters to savers weighing direct ownership against paper instruments.
COMEX rules also include emergency provisions for extreme scenarios, though those have not been invoked for a silver delivery month. Month after month, the coverage ratio records a structural difference between the size of the paper market and the available deliverable stock — and for those who prioritize immediate physical access, that difference is central to the decision.
What Should Investors Watch Next?
September’s First Notice Day arrives within days. Watch whether remaining contracts continue to roll off, whether registered inventory moves meaningfully, and whether the coverage ratio holds near 17.1% or tightens further. The same measurement will repeat at December’s First Notice Day, and each reading adds another piece to a pattern that has been consistent through the year.
Separately, both gold and silver remain near multi-month highs as markets prepare for a Jackson Hole speech from Fed Chair Kevin Warsh. That event is a separate catalyst from the delivery mechanics and deserves independent attention. Prior coverage of April’s First Notice Day documented a tighter 13–14% ratio; those earlier readings provide useful perspective when evaluating the current picture.
Stay On Top of Gold & Silver Prices
Receive important market alerts and analysis straight to your inbox.
SOURCES
1. CME Group — Precious Metals Outlook 2026: Market Dynamics Following a Record-Breaking Year
2. CME Group — Historical Registrar Reports, Warehouse & Depository Stocks (Silver Stocks), accessed August 27, 2026
3. CME Group — Daily Information Bulletin, Metals Futures Products (Section 62), July 24, 2026
4. COMEX September 2026 silver contract open interest and registered/eligible warehouse figures, as reported by independent market-data aggregators (Aug 24, 2026 reporting window)
5. Jeffrey Christian, Managing Director, CPM Group — comments on depository receipt redelivery mechanics within a single COMEX delivery month
Disclaimer: This article is for informational purposes only and does not constitute investment advice. Past performance is not indicative of future results. Always consult a qualified financial advisor before making investment decisions.
You May Also Like:
- Five Gold Signals Fired This Week. None of Them Are About Today’s Price.
- Gold Fell 9% the Last Time Warsh Spoke. He’s Back Tomorrow.
- Gold Ran Past Wall Street’s Own Price Targets. Four Banks Disagree on What Happens Next.
- Silver Beat Gold in August. Almost Nobody Said So.
- Americans Spent More in July. They Got Nothing Extra for It.
- The Fed Has Two Hike Numbers Right Now. Almost Everyone Quotes the Wrong One.
- Gold and Silver Pulled Back Today. The Treasury’s Plumbing Explains Why.
Popular Topics
Picked from the archive
-
01
 Topics
Fed’s September Shift: Impact on Gold Prices
-
02
Topics
5 Catalysts That Moved Gold and Silver This Week
-
03
Topics
Gold Price Tops $5,200, Silver $90 as Inflation Persists
-
04
Topics
Sound Money: Why the Dollar Has Lost 87% Since 1971
-
05
Topics
Gold Price Volatility Back to COVID-Era Levels
-
06
Topics
Gold Jumps 1% – Why July CPI Matters More Than the Headline
-
07
Topics
Why Gold Holds Value: The 5,000-Year Truth Investors Miss
-
08
Topics
Fed Decision Looms: Gold Poised for 8:30 AM Reaction