Fed’s September Shift: Impact on Gold Prices
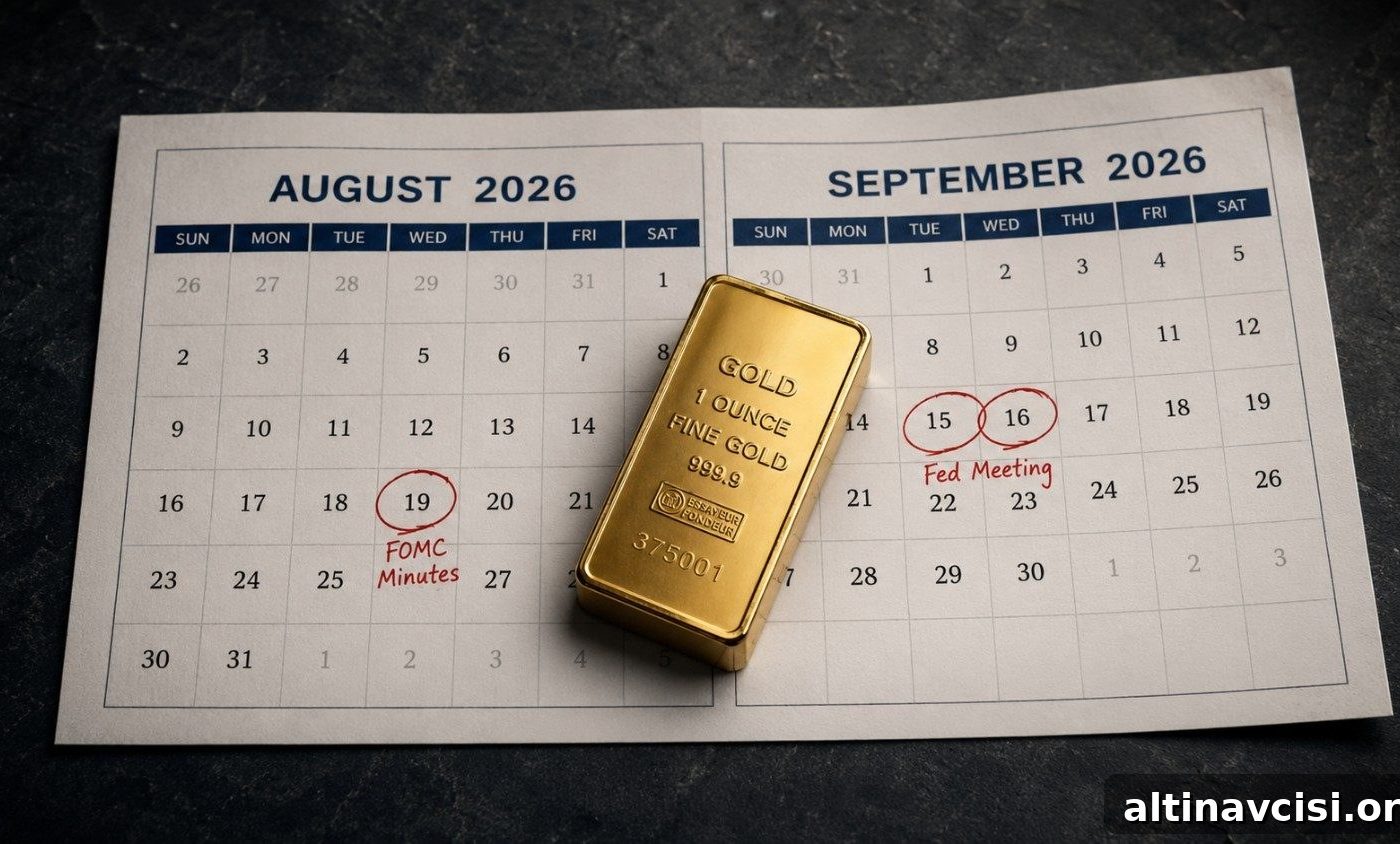
The Federal Reserve voted 9–3 to hold interest rates at its July 29 meeting; three members dissented, preferring an immediate hike. Since that decision, two key inflation releases—CPI and PPI—arrived softer than markets expected. Together, those prints have provided cover for the majority who favored waiting, reshaping expectations for September and helping to justify the Fed’s decision to pause.
Gold has reacted to this shift in expectations.
As of the morning of August 14, gold traded near $4,383 per ounce, up roughly $33 on the day. Silver stood near $65.05 per ounce, up about $0.57. Gold recorded a monthly gain exceeding 10%—its strongest August performance in several years—driven primarily by a rapid repricing of interest-rate expectations for September.
Gold Spot Price — 30-Day Trend (July 15 – August 14, 2026)
Two consecutive soft inflation prints pushed prices to two-month highs
Gold spot price
CPI / PPI release
Source: Gold and silver spot price data
Why Is the Gold Price Up Today?
The immediate catalyst was a pair of softer-than-expected inflation prints. On August 12 the Bureau of Labor Statistics reported that the Consumer Price Index rose 3.4% year-over-year in July, down from 3.5% in June and marking a second consecutive deceleration. The month-over-month CPI increase was just 0.1%. On August 13 the Producer Price Index for final demand showed no month-over-month change in July, a notable slowdown from earlier readings. Together the CPI and PPI reinforced a decelerating inflation narrative.
Those prints tightened the market’s view on September policy. The CME FedWatch tool moved sharply toward a September hold: the implied probability of no rate change rose to roughly 69% on August 14, up from about 42% a month earlier. That recalibration of rate expectations affects real yields—the difference between nominal interest rates and inflation expectations—and it is the core mechanism behind the gold rally.
Gold pays no interest, so its opportunity cost depends on real yields. When markets price in fewer hikes, real yields tend to compress, reducing the opportunity cost of holding non-yielding assets like gold. Historically, gold often moves $40–$60 per ounce for every 25 basis points of real-yield compression. That relationship explains much of the recent price action ahead of the forthcoming FOMC minutes.
Silver’s stronger advance is also telling. The gold-silver ratio compressed from above 70 in late July to about 67.4 on the morning of August 14, signaling that investors favor a policy hold rather than further hikes. Silver carries both a monetary and an industrial component, so its gains tend to be larger than gold’s when rate expectations ease.
The Edge Every Investor Needs
Smarter precious-metals investing starts here. The Nuggets Newsletter delivers concise market analysis, Fed updates, global trends, and educational content.
What Do the FOMC Minutes Mean for Gold and Silver Investors?
The Fed will release the minutes from its July 29 meeting on Tuesday, August 19 at 2:00 p.m. ET. That release is the most important scheduled event for precious-metals traders in the near term because it will offer a fuller view of the July deliberations and the views of the dissenting members.
If the minutes show the three dissenters used conditional or cautious language—indicating they would favor a hike only if upcoming inflation data showed renewed acceleration—the case for a September hold will strengthen. Conversely, if the minutes reveal the dissenters pressing for further tightening or the committee raising its inflation outlook materially, expect some giveback in recent gold and silver gains. Until the minutes are published, markets will continue to price probabilities between those scenarios.
What Does This Mean for Physical Gold and Silver Holders?
At face value, gold is up because two inflation prints came in soft. A deeper interpretation is that these prints reveal constraints on the Fed’s ability to tighten aggressively. U.S. government interest payments are set to exceed $1 trillion for the fiscal year for the first time, and rising rates would increase the cost of servicing a large national debt. That fiscal arithmetic makes aggressive rate hikes more difficult to sustain.
Every soft data point that gives the Fed’s hold faction a defensible rationale increases the likelihood of a pause. Gold is rising not because inflation is solved, but because markets are recalculating the probability that the Fed cannot or will not tighten as aggressively as the dissenting members prefer. That structural dynamic—tied to interest-costs and balance-sheet considerations—does not hinge on any single data release, which is why gold often moves on shifts in expectations rather than on one number alone.
Investors should also watch scheduled data like the University of Michigan’s preliminary August sentiment reading and monitor intraday price action to assess how new information shifts expectations.
SOURCES
1. Bureau of Labor Statistics — Consumer Price Index Summary, July 2026 (released August 12, 2026).
2. Bureau of Labor Statistics — Producer Price Index, July 2026 (released August 13, 2026).
3. CME Group FedWatch Tool — September 2026 FOMC rate probabilities (data referenced as of August 14, 2026).
4. Federal Reserve — FOMC statement and minutes schedule (July 29 meeting; minutes released August 19, 2026).
5. Gold and silver spot-price data — intraday price references, August 14, 2026.
6. University of Michigan, Surveys of Consumers — July 2026 final reading and August preliminary schedule.
7. Market commentary and analysis published August 14, 2026.
Disclaimer: This article is for informational purposes only and does not constitute investment advice. Past performance is not indicative of future results. Consult a qualified financial advisor before making investment decisions.
You May Also Like:
- Jackson Hole Is 14 Days Away. What Warsh Says Could Move Gold More Than Any Inflation Print.
- Gold Hit a Two-Month High. Then It Pulled Back. The PPI Data That Caused Both Moves Is What Matters.
- Two Soft Inflation Prints. Gold Is Still Below $4,500. One Number Is Keeping It There.
- China Bought the Most Gold Since 2023 in July. Here’s Why.
- Five Unrelated Forces All Moved Gold and Silver Higher Today. That Doesn’t Happen Often.
- Gold Climbs 1% Ahead of July CPI. Here Is Why the Print Matters More Than the Number.
Popular Topics
Picked from the archive
-
01
 Topics
Why Investors Are Buying Gold After Today’s Price Drop
-
02
Topics
5 Signs Gold’s Rally Is Gaining Momentum
-
03
Topics
Dollar Devalued 87% Since 1971: Why Central Banks Buy Gold
-
04
Topics
Why Global Silver Demand Exceeds Mining Supply
-
05
Topics
India Gold Import Duty Hike: Impact on Demand
-
06
Topics
Gold Price Tops $5,200, Silver $90 as Inflation Persists
-
07
Topics
How Gold and Silver Perform During Stagflation
-
08
Topics
Why $4,454 Gold Means the Fed Is Trapped