Fed Study: Oil Shocks Could Cause Lasting Inflation

Last verified November 16, 2026.
A Federal Reserve staff note published on November 9 uses data through the second quarter of 2026 to examine links between oil prices and inflation, including core inflation measures that exclude direct energy and food prices. Using a five-economy model, the study finds that a permanent 10% increase in oil prices would raise average core price levels by about 0.36% after three years under a set of newer dynamics; under earlier dynamics, the comparable model result is roughly 0.04%. These outcomes are conditional model estimates—not official U.S. forecasts and not annual inflation rates.
Key Takeaways
- The study, published November 9, analyzes data through Q2 2026.
- Figure 2 in the paper shows a larger and more persistent core-price response when both oil-price pass-through and inflation persistence rise.
- Separate U.S. estimates in the paper also indicate stronger pass-through, while the headline numerical comparison is a pooled, five-economy model result.
How do oil prices and inflation connect if core excludes energy?
“Core” inflation removes direct food and energy price changes from headline measures, but it does not disconnect consumers and producers from fuel costs. Oil and gasoline are inputs for production and transportation; higher fuel costs can raise firms’ operating expenses, which may later be reflected in the prices of non-energy goods and services. In that way, core inflation can capture the indirect effects of energy price moves even when energy itself is excluded from the index.
The authors studied quarterly data for Canada, the euro area, Japan, the U.K., and the United States through Q2 2026. For the U.S. they used the core personal consumption expenditures (PCE) price index; for the other economies they used core consumer price indexes. Their model estimates increased transmission from oil to core prices beginning in 2021, along with higher inflation persistence—meaning past core inflation carries more influence into future quarters. Together, these shifts imply that oil shocks could leave a longer-lasting imprint on consumer prices than earlier patterns suggested.
The Edge Every Investor Needs
Smarter precious metals investing starts here. The Nuggets Newsletter delivers market insights, Fed updates, global trends, educational videos, and timely analysis.
What does the model’s price-level increase mean?
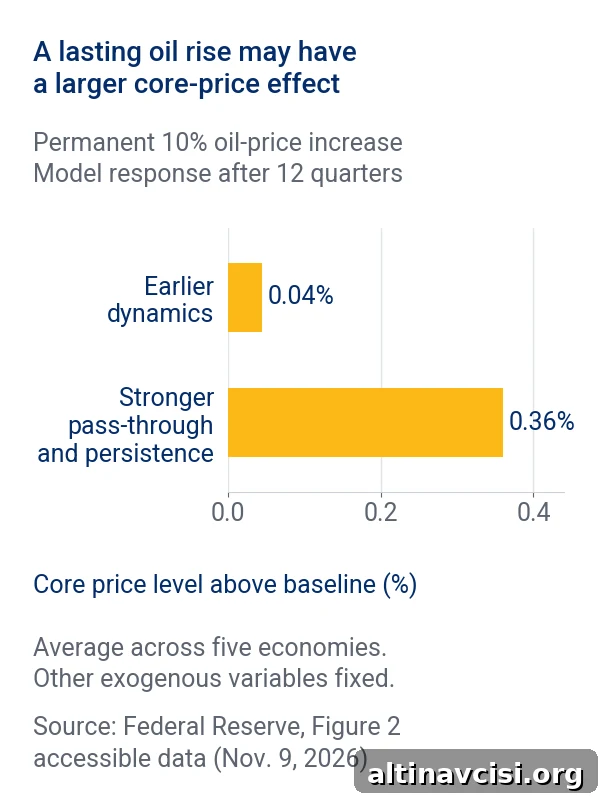
The model illustration assumes a permanent 10% rise in oil prices and holds other external factors constant. Based on the accessible table in the Fed note, core price levels sit roughly 0.04% above the baseline after 12 quarters under the earlier parameterization. Under the combination of stronger oil-price pass-through and higher inflation persistence, the model shows core prices about 0.36% above the baseline at the same horizon. Most of the modeled increase accumulates over the first eight quarters.
Data note: The Federal Reserve’s summary text lists the outcomes as 0.05% and 0.35%; this article and its chart use the quarter-12 values from the accessible table and round them to two decimal places.
Crucially, the difference refers to the price level itself—not an annualized addition to inflation each year. The study also includes a separate exercise (Figure 3) that uses oil futures from early August 2026 to illustrate potential inflation paths; the authors describe those paths as an upper bound rather than their central forecast.
Prior coverage of short-term market reactions to oil and interest-rate expectations is separate from this analysis, which focuses on how oil-related costs may spread through economies over several quarters and years.
What limits should U.S. readers keep in mind?
The Fed note emphasizes that second-round effects from recent oil-price shocks had not fully materialized by the study’s publication. The model cannot definitively separate structural changes in price-setting behavior from the effects of a short span of unusually frequent or persistent global shocks. Because the newer data cover a relatively brief and atypical period, the estimated increase in pass-through and persistence may reflect temporary conditions.
The paper’s country-level estimates show a statistically significant rise in oil-price pass-through for the United States, but the headline pooled figure (about 0.36%) is derived from the five-country comparison and should not be read as a bespoke U.S. forecast. The authors also clarify that their results are not official Federal Reserve projections. If either stronger pass-through or heightened persistence proves transitory, the actual effect on U.S. price levels could be smaller than the pooled model implies.
What does this mean if you own gold or silver?
If broad non-energy prices rise more persistently, the purchasing power of cash declines—one of the risks the Fed’s model helps illustrate. Different measures of purchasing power can give varied perspectives; for example, work that compares how much oil an ounce of gold buys considers one such alternative metric.
Gold and silver do not move one-to-one with monthly or quarterly CPI readings. Historical analyses—such as industry research comparing long-term changes in CPI and dollar gold—have found only a weak short-term correlation, while also suggesting a potential longer-term role for gold as part of a diversified portfolio. Higher real interest rates raise the opportunity cost of holding non-yielding assets like physical gold, and storage costs and price volatility also affect returns. The Fed study does not make predictions for gold or silver prices.
Going forward, U.S. economic data will help determine whether the stronger relationships estimated in the paper persist. For long-term precious-metals holders, the more useful question is how purchasing-power risks fit into an overall financial plan rather than how prices respond to any single oil shock.
Stay On Top of Gold & Silver Prices
Get important market alerts sent straight to your inbox.
SOURCES
1. Federal Reserve Board — The Effect of Oil Prices on Core Inflation: Recent Evidence from the Advanced Economies
2. Federal Reserve Board — The Effect of Oil Prices on Core Inflation: Recent Evidence from the Advanced Economies, Accessible Data
3. World Gold Council — Investment Update: Beyond CPI: Gold as a Strategic Inflation Hedge
4. World Gold Council — Gold Market Commentary
5. CFTC — Precious Metal Frauds
Disclaimer: This article is for informational purposes only and does not constitute investment advice. Past performance is not indicative of future results. Always consult a qualified financial advisor before making investment decisions.
You May Also Like:
- Gold Price Today Hits 13-Month Low, Silver Falls Faster
- Gold’s Price Higher Off 13-Month Low; Silver’s Isn’t
- 2026 Silver Deficit Forecast Shrinks; Tightness Eases
- October Budget Deficit: $404 Billion and the Gold Case
- Silver Mine Capacity: USGS Sees 4% Growth by 2030
- Gold Just Erased Its Entire Post-Election Rally
- Silver ETF Flows: India’s Data and U.S. Silver Owners
- Silver Outpaces Gold After CPI
- Gold Price Today: CPI Comes In Hot, Just as Waller Warned
Popular Topics
Picked from the archive
-
01
 Topics
Should You Buy Gold Now During a Dip? Timing and Risks
-
02
Topics
Bank of America’s $6,000 Gold Forecast Signals a Systemic Shift
-
03
Topics
Gold Price Outlook Sept 2026: Fed’s Sept 15–16 Meeting Impact
-
04
Topics
Gold Needed One Catalyst to Break $4,400 – It Just Got Five
-
05
Topics
Gold Price Falls Today: Why $4,500 Holds as Support
-
06
Topics
Gold Drops as China Buys Most in 17 Months
-
07
Topics
Gold Risk-Reward Calculator: Is Your Portfolio Secure?
-
08
Topics
300 Billion Lesson: What Frozen Reserves Revealed About Gold