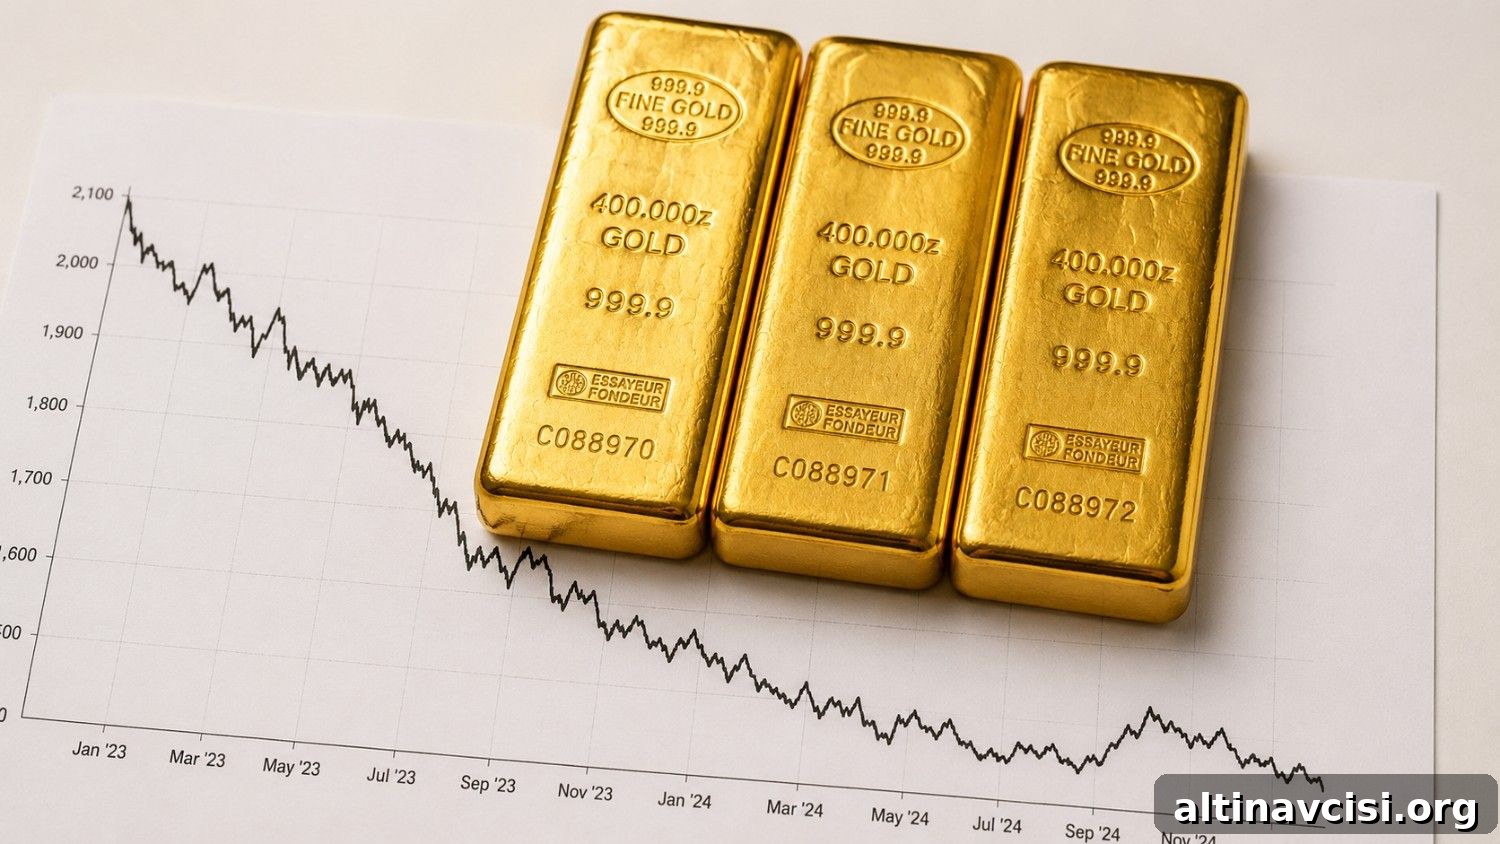
The world’s central banks did something notable in the second quarter of 2026. Even as gold experienced its steepest quarterly price decline in a decade, official buyers accumulated more gold than in any previous Q2 on record.
On July 30, the World Gold Council released its Gold Demand Trends Q2 2026 report. The standout figure: central banks added a net 289 tonnes of gold in Q2 — a 62% increase year-over-year and the strongest second quarter in the data series. To put that scale into perspective, 289 tonnes in a single quarter exceeds the total net ETF flows recorded across the globe for all of 2023, a year that saw 244 tonnes of net ETF outflows.
What makes this data striking is the timing. Prices moved sharply lower from the elevated levels seen in Q1. Yet central banks accelerated their purchases as prices fell.
Why Did Central Banks Buy More Gold When Prices Were Falling?
Reserve managers do not treat gold the same way hedge funds or short-term traders do. For central banks, gold is a structural reserve asset, not a speculative position. When prices fall, the rationale for reserve accumulation does not flip; if anything, lower prices strengthen the case for adding to holdings. Buying at reduced prices lowers the long-term cost basis for a permanent reserve holding.
The WGC’s 2026 Central Bank Gold Reserves Survey, which included responses from 76 reserve managers (the highest participation in the survey’s nine-year history), helps explain the motivation. According to the survey, 89% of respondents expect global central bank gold holdings to rise over the next 12 months. 45% plan to increase their own institution’s reserves. And 74% expect the dollar’s share of global reserves to decline over the next five years.
That last statistic points to the broader mechanism at work. Many central banks are shifting away from dollar-denominated assets and rotating into gold as part of a strategic diversification of reserves. This rotation proceeds regardless of quarterly price swings — price influences timing and volume at the margin, but it does not change the underlying strategic decision to diversify away from reserves dominated by a single fiat currency.
Poland and China were notable leaders in Q2. The National Bank of Poland added 51 tonnes, raising its total to 632 tonnes. The People’s Bank of China purchased 33 tonnes, its largest quarterly addition since late 2023. Uzbekistan and Kazakhstan also made meaningful additions, while Russia sold a small amount to cover budget needs. Those sales by a few countries mean the headline net figure understates the broader appetite among many central banks to accumulate gold.

The Edge Every Investor Needs
Smarter precious metals investing starts here. The Nuggets Newsletter offers concise market insights, Fed updates, global trends, and educational content to help you stay informed.
What Did the Rest of the Q2 Gold Demand Picture Look Like?
Total gold demand, including over-the-counter transactions, remained steady year-over-year at 1,269 tonnes in Q2. Demand for the first half of the year reached 2,522 tonnes, up 2% from the prior year, with a record aggregate value of $380 billion. That record dollar figure is notable: even though gold fell from January’s all-time price highs, the total dollar value of global gold demand reached unprecedented levels.
Within those totals, the demand picture split along clear lines. Exchange-traded gold funds recorded 45 tonnes of net outflows as some investors sold into weakness. In contrast, physical bar and coin demand held up at 307 tonnes, down only 3% year-over-year, with particularly strong buying from Middle Eastern markets during the price dip. Jewellery demand fell to 278 tonnes — its lowest level since the pandemic — as elevated prices reduced fabrication volumes. Yet spending on gold jewellery rose by 14% in dollar terms, reflecting a shift toward lighter, higher-priced items purchased by wealthier consumers.
An important revision in the data deserves attention: the WGC adjusted Q1 central bank demand down from 244 tonnes to 57 tonnes after reclassifying a large portion as over-the-counter (OTC) demand. OTC buying surged to 327 tonnes in Q2 alone; this category covers sovereign wealth funds and government entities that do not publicly report all transactions. Adding OTC purchases to the 289-tonne official number suggests institutional demand in Q2 was even larger than the headline figure implies.
What Does This Mean for Your Gold Allocation?
Central banks are among the most informed, long-duration holders of financial assets. They manage reserves with multi-decade horizons. When surveyed reserve managers state, during a period of falling prices, that 89% expect global gold holdings to rise and 74% expect the dollar’s reserve share to decline, they are signaling a strategic view of the monetary landscape rather than making a short-term technical call.
The dollar’s share of global foreign exchange reserves has been drifting lower for years while gold’s share has inched higher. This shift is not about speculation; it reflects risk-management choices by sovereign reserve desks who recognize the limits of relying on a single, broadly issued fiat currency. In that context, an asset that cannot be created by central banks — like gold — becomes relatively more attractive as a diversification tool.
Q2’s record central bank buying did not stop prices from falling during the quarter. Demand statistics are a lagging indicator of structural positioning, not a reliable short-term price predictor. Still, the fact that central banks bought 289 tonnes into weakness confirms that the structural support beneath gold demand is being rebuilt, quarter by quarter. By late July, prices had begun to stabilize and were on track for their first monthly gain since February.
The critical question is not how 289 tonnes will affect gold’s price next week, but what happens when the largest quarterly central bank purchase on record meets a recovering market. That combination has the potential to reshape supply-demand dynamics over the medium term.
Stay On Top of Gold & Silver Prices
Get important market alerts and concise updates delivered to your inbox.
SOURCES
1. World Gold Council — Gold Demand Trends Q2 2026
2. World Gold Council — Gold Market Shows Resilience as Price Momentum Cools in Q2
3. World Gold Council — Central Bank Gold Reserves Survey 2026
4. GoldSilver — Gold & Silver Spot Prices
Disclaimer: This article is for informational purposes only and does not constitute financial or investment advice. Always consult a qualified financial adviser before making investment decisions.
You May Also Like:
- Warsh Said the PCE Drop Was “Not Much” of a Consideration. Gold Agreed.
- Gold at $4,100. Silver Still Stuck Below $60. Five Signals Define the Next Six Weeks.
- Oil Spiked 8%. Gold Went Up Anyway. Here Is Why This Time Is Different.
- Gold Is Up $40. Here Is What the 9-3 Fed Vote Actually Means.
- Iran Fired Missiles. Oil Spiked 6%. Gold Fell. The Three-Step Chain Behind the Move.
- Everyone Is Watching the Fed. Gold Is Watching Tomorrow at 8:30 a.m.