Federal Reserve Report: U.S. Consumer Credit Climbs $27.8 Billion

Last verified November 9, 2026.
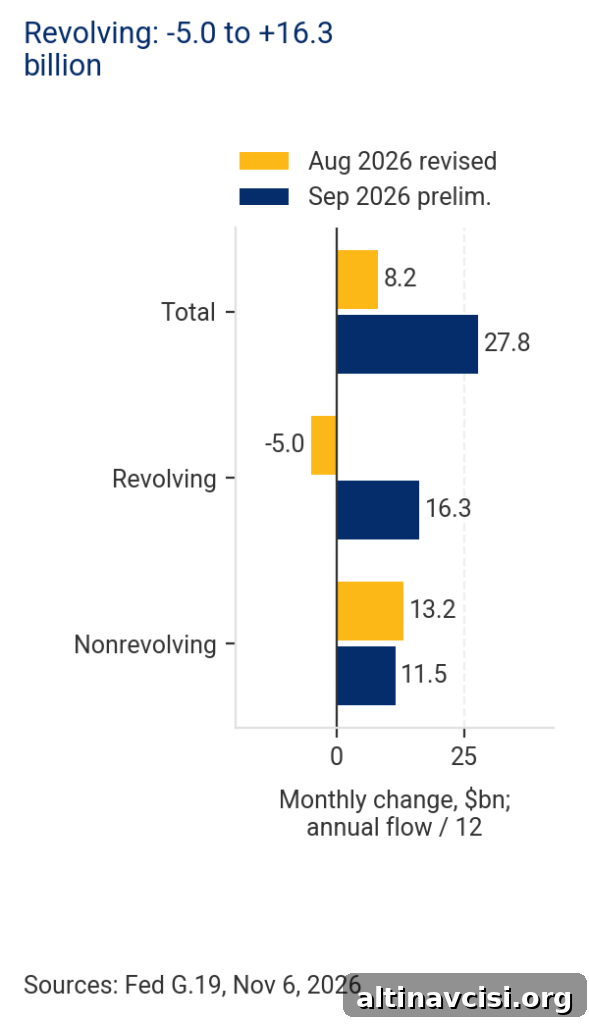
The Federal Reserve’s G.19 release dated November 6, 2026, reports that preliminary consumer credit rose by approximately $27.8 billion in September 2026. Of that increase, about $16.3 billion — roughly 59% of the gain — came from revolving credit, the category that includes credit cards and other accounts you can borrow against repeatedly. Revolving balances had been revised down by about $5.0 billion in August, so September’s reversal largely reflects a shift in the borrowing mix rather than revealing who borrowed or the rates they actually paid.
Key Takeaways
- The Federal Reserve’s November 6, 2026 G.19 release shows a preliminary September increase of roughly $27.8 billion, compared with an $8.2 billion revision for August.
- Revolving credit declined by about $5.0 billion in August and then rose by $16.3 billion in September, making up roughly 59% of September’s total gain.
- The Federal Reserve’s published commercial-bank credit-card account interest rate for Q3 2026 (August) is 22.36% for accounts assessed interest; this is not a universal or current rate for every borrower.
How did September 2026 consumer credit change?
According to the Fed’s November 6 release, total consumer credit stood at $5.2244 trillion in September 2026, up from $5.1966 trillion in August on a seasonally adjusted basis. The Fed revised August’s numbers while September remains preliminary, so month-to-month comparisons require caution. The $27.8 billion September increase is more than three times the roughly $8.2 billion reported for August after revision, but a single month does not establish a durable trend.
Most of the September increase came from “revolving credit,” the category that typically covers credit cards and some overdraft plans — accounts you can draw on again as you pay them down. Revolving balances rose about $16.3 billion in September after falling roughly $5.0 billion in August. Nonrevolving credit, which includes fixed-term loans like auto and student loans, grew by about $11.5 billion in September versus a $13.2 billion increase in August. In other words, the composition of change shifted noticeably even though total credit expanded moderately.
The Federal Reserve presents these monthly flows as annualized figures in the G.19 tables. To make straightforward month-to-month comparisons, we divided the annualized flows by 12 and rounded. Similarly, the Fed’s reported 6.4% total growth and 14.5% revolving growth for September are annualized growth rates, not one-month percentage changes and certainly not interest rates on loans. The G.19 release also excludes lending secured by real estate, and while most revolving credit is card-based, the category can include other short-term plans such as overdrafts. It therefore does not represent total household debt or an all-card statistic.
Does a jump in balances mean more people pay interest?
No — the aggregate G.19 totals do not reveal how many cardholders paid their balances in full versus those who carried balances and incurred interest. That said, carrying a balance that accrues interest has a real, measurable cost. The Fed’s rate table for Q3 2026 (August) shows 22.36% for commercial-bank credit-card accounts that were assessed interest; the Fed did not publish a September rate for that specific table. Therefore, 22.36% is not a current or universal rate for all revolving borrowers, but it does indicate the high penalty some accounts face when balances are carried month to month.
If you carry interest-bearing card balances, interest payments can consume funds that might otherwise be saved or held in short-term reserves. Maintaining liquid cash reserves helps cover unexpected expenses without forcing the sale of assets at unfavorable prices. That consideration is a practical risk-management point for savers and borrowers, not a direct conclusion about the population of September borrowers. Prior coverage from February 12, 2026 addressed related credit-card trends using a different New York Fed dataset and is separate from these G.19 figures.
What does this mean for physical gold and silver?
Physical gold and silver can serve as part of a diversified approach to monetary and counterparty risk over the long term, but they are not substitutes for cash when immediate bills are due. Physical metal does not earn interest, can fluctuate in market price, and carries costs for purchase, storage and eventual sale. If you must sell bullion to meet a payment, market timing and liquidity constraints could affect the proceeds you receive. That tradeoff — liquidity versus long-term diversification — is central to deciding how much exposure to maintain in metals versus liquid cash.
The G.19 report offers no basis to claim an imminent gold rally or a broad wave of missed debt payments. The New York Fed announced on November 4, 2026 that its Q3 household debt and credit report was scheduled for release on November 10; at the time of final verification for this piece, that report had not yet been published. For savers and investors, the immediate, practical question is how much of your monthly cash flow goes to interest and how much you can comfortably keep available for short-term needs.
Stay On Top of Gold & Silver Prices
Get important market alerts sent straight to your inbox.

SOURCES
1. Federal Reserve Board — Consumer Credit (G.19), November 6, 2026.
2. Federal Reserve Board — About the G.19 Consumer Credit Release.
3. Federal Reserve Bank of New York — Notice of Q3 2026 Household Debt and Credit report release.
Disclaimer: This article is for informational purposes only and does not constitute investment advice. Past performance is not indicative of future results. Always consult a qualified financial advisor before making investment decisions.
You May Also Like:
- Gold Price Before CPI: Bullion Rebounds Above $4,100
- Gold Falls, Silver Holds Firm on Jobs Report
- October Gold ETF Holdings Rose as Fund Assets Fell 6%
- Bank of England Rate Hike to 4%: Two Forces for Gold Owners
- Gold Climbs to $4,124 as Treasury Yields Slide
- Gold & Silver Price Today: Midterm Election Results Spark Rally
- Gold, Silver Price Today: Gold Nears $3,970 Resistance
- Q3 Central Bank Gold Buying +42%, Bar-and-Coin Demand -19%
- Gold, Silver Prices Today: Why Are They Rebounding?
Popular Topics
Picked from the archive
-
01
 Topics
Why Investors Choose the Vienna Philharmonic Gold Coin
-
02
Topics
Stablecoin Issuer Outspent Central Banks on Gold Last Year
-
03
Topics
Why Gold Prices Are Falling Amid the Oil War
-
04
Topics
How to Buy Gold in 2026: Step-by-Step Guide for Beginners
-
05
Topics
Silver Appears Weak, Silver-to-Gold Ratio Signals Accumulation
-
06
Topics
Why Gold Prices Are Falling: What Most Investors Get Wrong
-
07
Topics
Should You Still Hold Gold in Your Portfolio?
-
08
Topics
Gold Bars vs Jewelry: Why Investors Choose Bullion