Q3 Gold Buyers Split as Central Banks Boost Purchases 42%

Last verified November 2026.
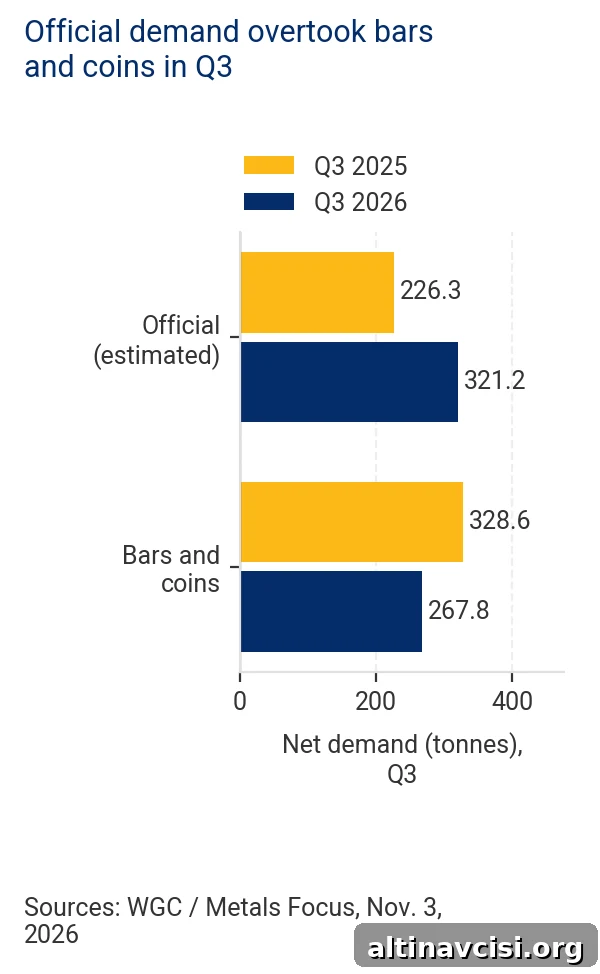
Central bank gold buying rose sharply in the third quarter of 2026, while private purchases of bars and coins declined. The World Gold Council’s November 3, 2026 report estimates official-sector net demand at 321.2 tonnes for Q3, a 42% increase from the same quarter a year earlier. By contrast, physical bar-and-coin investment fell 19% to 267.8 tonnes over the same period. These figures reflect differing buyer priorities and timing; they are descriptive, not a prediction of gold’s next price move.
The quarterly totals cover July through September 2026 and are not limited to transactions reported on the report’s publication date. For comparison, Q3 2025 official net demand was 226.3 tonnes and bar-and-coin investment was 328.6 tonnes. The World Gold Council presents both years’ figures so we can compare trends within each category.
Key Takeaways
- The World Gold Council’s November 3, 2026 report estimates official net demand in Q3 at 321.2 tonnes, up 42% year-on-year. Only about 120 tonnes of that total were recorded in reported country disclosures; the remainder reflects estimated unreported or late-reported buying.
- Global bar-and-coin investment fell 19% to 267.8 tonnes in Q3, while physically backed gold ETFs added 211.2 tonnes. Not all private gold demand weakened—different channels moved in different directions.
- The council attributes the official buying to reserve management objectives and notes that price-sensitive private buyers may have delayed purchases amid uncertain price direction and the possibility of higher US interest rates. The split between buyers does not by itself establish a price floor for gold.
How much central bank gold buying was reported?
The World Gold Council notes reported net purchases of about 120 tonnes for Q3, while its broader estimate of official net demand is 321.2 tonnes. The larger figure includes central banks and other official buyers and incorporates an estimate for purchases that were not disclosed in country reports. In other words, roughly 63% of the council’s estimated official buying was not visible in the publicly reported country-level data at the time of the release. This gap represents estimated unreported buying or purchases that were reported late and could change if countries publish additional details.
Because the council’s quarterly estimate aggregates all official flows, it is not directly comparable to single-month tallies from separate articles or disclosures. A previously published item that cited 39 tonnes of disclosed purchases in August, for example, covered a different scope and should not be added to the Q3 estimate—those figures measure different things over different timeframes.

The Edge Every Investor Needs
Smarter precious metals investing starts here. The Nuggets Newsletter delivers market insight, Fed updates, global trends and educational content.
Subscribe to the newsletter for concise market updates and alerts.
Why did bars and coins lag?
The council’s investment chapter points to several factors behind weaker bar-and-coin demand: a lack of clear directional momentum in gold prices during the quarter, market expectations for higher US interest rates for longer, and stronger equity markets that can attract savings away from physical metal. These broad explanations describe the environment that likely discouraged some retail buyers, but they do not prove the motives of every individual purchaser.
For example, savers who can earn interest on cash or fixed-income products may postpone buying physical bullion, which does not pay interest and carries storage costs. In the United States, bar-and-coin purchases fell to 8.2 tonnes in Q3 from 13.5 tonnes a year earlier, a decline of roughly 40% for that market. Still, the council notes that global bar-and-coin flows for January through September totaled about 1,053 tonnes, its strongest nine-month total since 2013. A softer quarter does not erase strong buying earlier in the year.
Did all private gold buyers pull back?
No. Different channels showed different behavior. Physically backed exchange-traded funds (ETFs) added about 211.2 tonnes to their holdings in Q3, reversing a Q2 outflow reported in the same World Gold Council release. That means fund investors were buyers even as some retail buyers of bars and coins stepped back. These are distinct forms of private demand—ETF shares are a way to gain exposure without taking physical possession.
Overall total gold demand, which includes jewellery, technology, investment, and over-the-counter flows, fell about 1% year-on-year to 1,368.6 tonnes in Q3. The broad picture shows a mixed market, not uniform strength or weakness across all buyer types.
What does the split mean if you own physical gold?
Central banks use gold to diversify reserves because it is not an obligation issued by another party in the way a bond is. The World Gold Council emphasizes reserve diversification and, to a lesser extent, the appeal of lower price volatility as drivers of official buying. Quarterly totals cannot, however, reveal the individual rationale of every central bank.
If you own bullion, remember the trade-offs: gold can reduce counterparty risk but exposes you to price volatility, storage and insurance costs, and it does not generate interest. Gold-backed ETFs provide convenient exposure and liquidity but do not transfer physical metal into your possession. Your own objectives—liquidity needs, time horizon, and risk tolerance—should determine whether and how much physical gold you hold, rather than simply mimicking reserve managers.
The Q3 report does not establish a guaranteed support level under gold prices. Additional country reports could narrow the difference between the 120 tonnes reported and the council’s larger estimate, and future flows of bars, coins and ETF holdings will show whether the current split persists.
Stay On Top of Gold & Silver Prices
Get important market alerts sent straight to your inbox.
Subscription form removed to avoid external scripts. Visit the site’s newsletter page to sign up.
SOURCES
1. World Gold Council — Gold Demand Trends: Q3 2026 (Gold Demand Trends)
2. World Gold Council — Gold Demand Trends: Q3 2026 (Central Banks)
3. World Gold Council — Gold Demand Trends: Q3 2026 (Investment)
4. GoldSilver — Central Bank Gold Buying: Why 39 Tonnes Matters (October commentary)
5. GoldSilver — Gold ETFs and central bank buying (previous quarter commentary)
Disclaimer: This article is for informational purposes only and does not constitute investment advice. Past performance is not indicative of future results. Consult a qualified financial advisor before making investment decisions.
You May Also Like:
- Gold, Silver Prices Today: Why Are They Rebounding?
- Gold and Silver’s October Selloff: What Changed?
- Silver Price Below $50: Why It’s Falling Faster Than Gold
- China Gold Imports via Hong Kong: Up Over 28%, Demand Mixed
- World Bank Precious Metals Outlook: 2027 Forecast
- Silver Tests Its 2026 Low Again
- Gold Price Today: Does It Rise or Fall in an AI Stock Selloff?
- Durable Goods Beat: What It Means for Gold Price Today
- Gold Steadies Near $4,000 as Fed Week Begins
- Russia Is Selling Gold: Why That’s Not Bearish
Popular Topics
Picked from the archive
-
01
 Topics
Why Investors Choose the Vienna Philharmonic Gold Coin
-
02
Topics
Stablecoin Issuer Outspent Central Banks on Gold Last Year
-
03
Topics
Why Gold Prices Are Falling Amid the Oil War
-
04
Topics
How to Buy Gold in 2026: Step-by-Step Guide for Beginners
-
05
Topics
Silver Appears Weak, Silver-to-Gold Ratio Signals Accumulation
-
06
Topics
Why Gold Prices Are Falling: What Most Investors Get Wrong
-
07
Topics
Should You Still Hold Gold in Your Portfolio?
-
08
Topics
Gold Bars vs Jewelry: Why Investors Choose Bullion