Who’s Right About Gold Now? 5 Market Signals and What They Mean

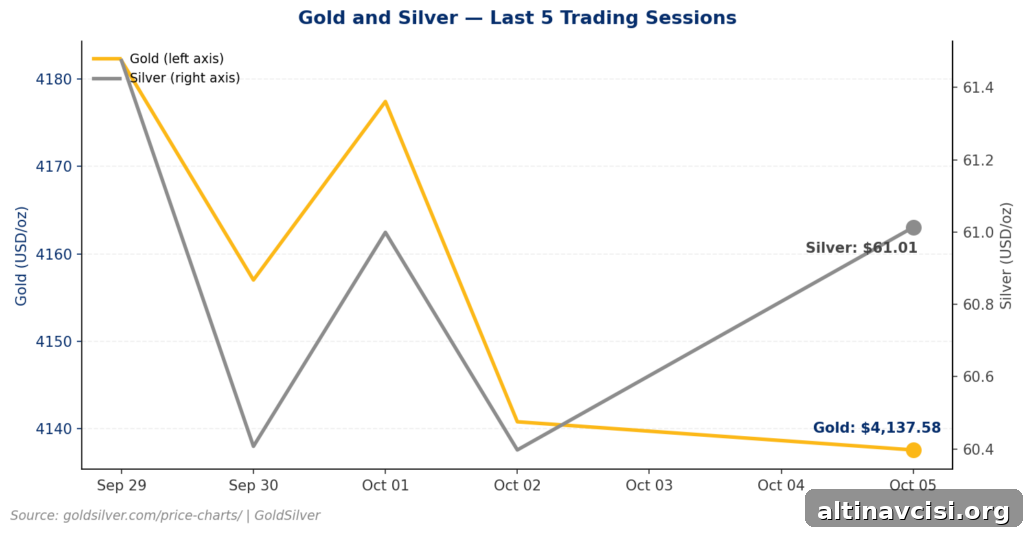
Short answer: none of the five indicators below is incorrect. Each reflects a different time horizon and a different market mechanism, so they can appear to conflict without actually contradicting one another. As of October 5, 2026, gold trades near $4,138 and silver near $61. A top Deutsche Bank strategist calls gold oversold and underowned; a technical desk warns of a breakdown toward $4,000; the IMF describes bond markets as “orderly” even as gold’s behavior suggests more nuance; and silver’s futures volume rose 61% year-over-year [CME Group]. Below is a clear explanation of what each signal actually means for investors and traders.
Is Gold Oversold and Underowned, According to Deutsche Bank?
Yes — at least according to Daniel Ghali, Deutsche Bank’s head of metals research. In an interview with BNN Bloomberg he described the recent pullback in gold as relatively limited. The primary driver he highlights is the rapid rise in 10-year Treasury yields, which have moved past 5%. Historically, when real yields climb quickly, gold often falls more sharply than it has this time. That disconnect points to thin positioning: large buyers largely remained on the sidelines after the Iran war shock, leaving the market underowned relative to the macro backdrop.
Ghali also disputes the simplistic idea that gold and bonds are always competing for the same pool of dollars. In his view, the bear market in Treasuries is actually pushing some institutional capital toward gold rather than pulling it away. He warns that silver carries greater near-term risk because supply dynamics in that market appear more vulnerable to oversupply pressure.

The Edge Every Investor Needs
Smarter precious-metals investing starts here. The Nuggets Newsletter delivers market insights, Fed updates, global trends, and educational analysis straight to your inbox.
Why Are Professional Traders and Everyday Gold Buyers Reading This Selloff Differently?
The answer is time horizon. Professional desks such as Ghali’s are positioning for the next two to three years; retail investors typically react to the immediate chart and recent price action. That difference is visible in social and community channels: one group focuses on weak technical signals and asks “what’s next,” while experienced stackers often express confidence in buying the dip.
That divergence itself is informative. Professional conviction has stayed relatively steady while retail sentiment has split into two camps. Markets tend to form durable tops or bottoms once a clear consensus emerges; persistent disagreement means the move has not yet resolved into a decisive trend.
Does Gold’s Resilience Contradict the IMF’s Claim That Bond Markets Are “Orderly”?
Not exactly. IMF spokesperson Julie Kozack described global bond markets as “orderly” even as the 10-year U.S. Treasury yield posted its largest quarterly rise this century. “Orderly” means markets are functioning, but it does not imply there is no risk. Term premia — the extra yield investors demand to hold long-dated debt — have risen in the U.S., UK, France, and Germany as inflation remains sticky and government finances deteriorate.
Rising yields can reflect two very different realities: either a stronger economy that crowds out gold, or a higher risk premium driven by fiscal and geopolitical concerns. If the latter is dominant, then the conventional negative relationship between yields and gold becomes less reliable. Gold holding above $4,000 through rising yields suggests the market is pricing a risk-premium story rather than a pure “growth outcompetes gold” story.
What Is Silver’s 61% Futures Volume Surge Actually Signaling?
A 61% year-over-year jump in micro-futures volume for silver (reported for September) indicates active positioning around supply dynamics, not just momentum chasing. Traders are balancing expectations of a sixth consecutive annual supply deficit against ongoing Fed uncertainty. That elevated activity points to participants hedging or speculating on continued tightness rather than purely trading short-term volatility.
COMEX warehouse data for the week of September 18–25 offers more nuance. Total silver inventory rose by roughly 2.5 million ounces, but the composition shifted: registered stock (metal immediately available for delivery) fell by about 1 million ounces while eligible stock (vaulted metal not earmarked for settlement) rose by roughly 3.5 million ounces. That pattern—owners parking metal in eligible status rather than lining it up for delivery—reads like constrained available supply even if headline inventory ticks up.
Is Gold’s Chart Pattern Warning of a Drop to $4,000?
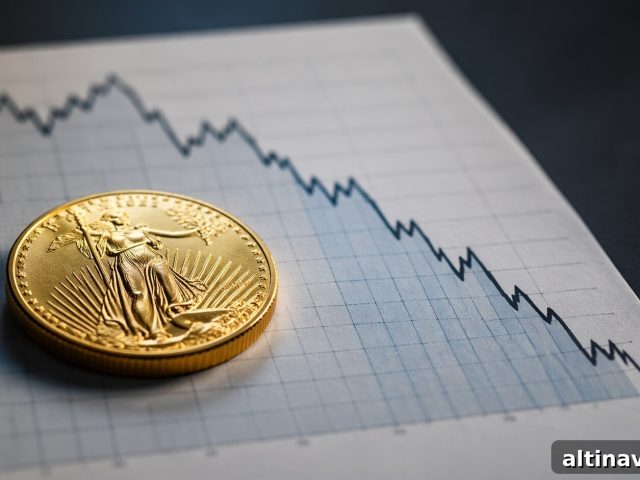
This is the technical view put forward by StoneX. Their desk identifies a descending triangle pattern: a series of lower highs converging on a relatively flat support level. A confirmed breakdown from that pattern would point to a test of $4,000—the same level gold briefly fell below in June before recovering through the summer and fall.
A revisit to $4,000 would not negate the long-term rationale for holding gold. Structural factors such as central bank demand, sovereign balance-sheet stress, and the relationship between real yields and precious metals remain intact. Rather, a short-term test of $4,000 would reflect technical selling catching up to prices that fundamental buyers have been defending for weeks.
Stay On Top of Gold & Silver Prices
Receive timely market alerts and concise analysis delivered to your inbox.
SOURCES
1. InvestingLive — Deutsche Bank’s Ghali Says Gold Oversold and Underowned, Urges Buying in Interview (BNN Bloomberg), October 2, 2026
2. Investing.com — IMF Says Bond Markets Functioning Orderly Despite Yield Surge (Reuters), October 1, 2026
3. ad-hoc-news.de — Silver’s Micro-Futures Surge 61% as Traders Weigh Record Supply Gap Against Fed Uncertainty (CME Group), October 4, 2026
4. MetalsDaily.com — StoneX: Gold Breaks Down on Descending Triangle, Sets Up $4K Test, October 3, 2026
5. Engineering News — Persistent Deficit, Firm Investment Demand Underpin Silver Outlook (Silver Institute / Metals Focus), May 1, 2026
6. World Gold Council — Gold Mid-Year Outlook 2026: Point Break (mid-year)
Disclaimer: This article is for informational purposes only and does not constitute investment advice. Past performance is not indicative of future results. Consult a qualified financial advisor before making investment decisions.
You May Also Like:
- Gold and Silver Are Rising Today. So Is the Dollar. That’s Rare.
- When Should a Central Bank Sell Its Gold? One Just Did. Most Won’t.
- September Payrolls Missed. Gold and Silver Reacted Immediately.
- The ISM Manufacturing Number Barely Moved. The Underlying Price Component Jumped.
- Morgan Stanley Names a Potential Floor for Gold. Here’s the Level.
- Gold Steadies Near $4,180 After a GDP Upgrade Undercuts an Inflation Surprise.
- BlackRock Calls a Metals Supercycle. Mines and Vaults Agree.
- Gold Jumps as Core PCE Cools More Than Expected, Overshadowing Other Data.
- Job Openings Missed Today—Exactly Why Gold Caught a Bid.
Popular Topics
Picked from the archive
-
01
 Topics
Why Investors Choose the Vienna Philharmonic Gold Coin
-
02
Topics
Stablecoin Issuer Outspent Central Banks on Gold Last Year
-
03
Topics
Why Gold Prices Are Falling Amid the Oil War
-
04
Topics
How to Buy Gold in 2026: Step-by-Step Guide for Beginners
-
05
Topics
Silver Appears Weak, Silver-to-Gold Ratio Signals Accumulation
-
06
Topics
Why Gold Prices Are Falling: What Most Investors Get Wrong
-
07
Topics
Should You Still Hold Gold in Your Portfolio?
-
08
Topics
Gold Bars vs Jewelry: Why Investors Choose Bullion