Fed Rate Hike Odds Flip After Swings From 54% to 26% to 58%

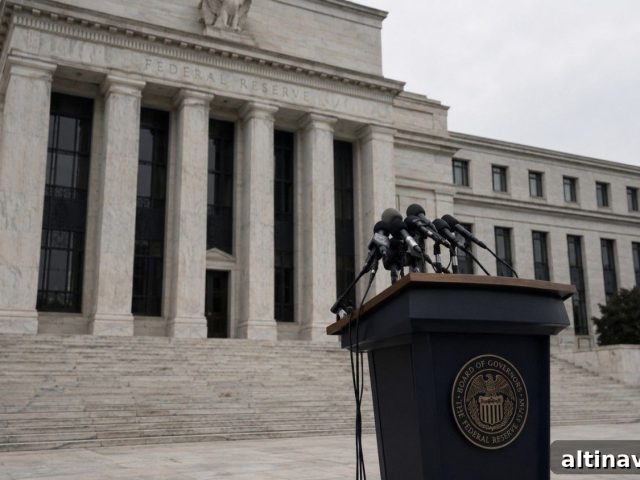
Traders now treat the Federal Reserve’s September 16 decision as essentially a coin flip. Six weeks ago the outlook was very different: probabilities swung from the mid-50s to the mid-20s, then up past the high-50s, and have now returned to roughly even. That rapid back-and-forth—not the vote itself—is the defining market story right now.
Key takeaways:
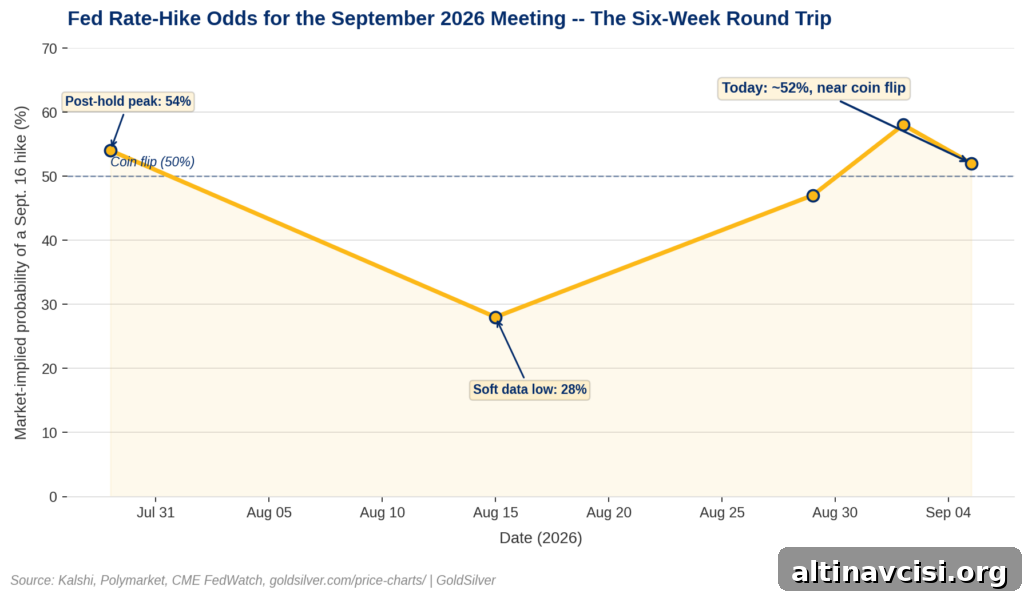
- Market odds for a September 16 quarter-point Fed hike moved from about 54% (late July) to roughly 26%–31% (mid-August), then climbed above 58% (early September), before settling near 52%–53% today.
- Gold’s roughly 10% rally in August—the metal’s best month since January—tracked the mid‑August decline in hike odds. The real-yield dynamic driving gold’s moves remained intact; it simply shifted quickly, more than once.
- Futures positioning is heavily long heading into a genuinely binary event: speculative traders held a net long position near 228,000 managed-money gold contracts as of early September. That crowding raises the chance of outsized moves if the Fed surprises in either direction.
What’s actually happening with Fed rate-hike odds right now?
As of September 4–5, market pricing put a quarter-point hike on September 16 at roughly 52%–53%, with the probability of holding at about 46%–47%. Other prediction venues show a similar split, near 53% for a hike. That near-even division is notable because it reflects unusually rapid shifts in expectations over a short period.
Where do gold and silver prices stand today?
On September 9, gold traded in the mid-$4,400s, about 21% below its January 2026 record near $5,589. Silver was in the high-$60s, roughly 44% beneath its January peak around $121.60. Both metals are pricing in some of the Fed uncertainty while also reacting to commodity and geopolitical developments that have influenced markets this week. Neither metal has fully discounted the Fed’s next move, and silver’s larger swings versus gold underscore how unsettled the setup remains.

The Edge Every Investor Needs
Smarter precious-metals investing begins with timely information. The Nuggets newsletter delivers market insights, Fed updates, global trends, and educational content to help investors stay informed.
How did hike odds swing so much in six weeks?
The Fed left rates unchanged at its July 28–29 meeting on a 9–3 vote, with three members voting to raise. Immediately after that meeting, markets priced a September hike at roughly 54% and similar tools showed comparable odds. Then incoming economic data—softer readings on jobs, consumer prices, and producer prices—pushed the probability of a September hike down into the mid‑20s by mid‑August. That same mid‑August window coincided with gold’s strongest monthly advance since January.
At the Jackson Hole symposium on August 28–29, Fed Chair Kevin Warsh’s comments signaled continued inflationary pressure, and market odds swung back up. Within a day those probabilities rose into the mid‑40s, and by early September several sources showed a hike as the favored outcome. By September 4–5, odds eased slightly, leaving the market roughly balanced going into the meeting.
Why does a rate hike hurt gold prices?
A rate increase raises the opportunity cost of holding non-yielding assets like bullion by pushing real yields higher—the return on cash and bonds after accounting for inflation. When hike odds fell in mid‑August, market expectations for real yields eased and gold rallied. When rhetoric turned more hawkish later in August, gold retraced some of that gain. The linkage between real yields and gold has functioned consistently; what changed was the speed and magnitude of shifts in expectations.
What is Wall Street actually pricing in for gold?
The federal funds target has been in the 3.50%–3.75% range across five consecutive 2026 meetings, and a hold on September 16 would mark a sixth. Professional forecasts for year‑end gold vary widely: some banks project materially higher prices, others expect more modest gains. Those divergent price targets reflect differing assumptions about growth, inflation, and Fed policy, which keeps the market’s outlook unsettled.
What’s the real risk heading into September 16?
The main risk is not strictly which way the Fed votes, but that positioning in futures markets is heavily skewed and a genuine coin‑flip outcome looms. By September 1, speculative traders held a net long position of roughly 228,000 managed-money gold contracts—one of the most one-sided readings this year. When many traders are crowded on the same side of a highly uncertain event, the potential for a large price swing increases sharply if the decision surprises expectations in either direction.
A subtler but important risk is fiscal: interest on federal debt has risen to a level near $1 trillion annually, representing a material share of federal revenue. That dynamic constrains the Fed’s choices: tightening too aggressively raises financing costs quickly, while holding rates for too long allows inflationary pressures to erode purchasing power. Gold, which is held outside the banking system, does not depend on how the Fed resolves that trade-off and often performs as a hedge against policy uncertainty.
What should investors watch next?
The key date is September 16 at 2:00 pm Eastern, when the Fed will release its statement, an updated dot plot, and the chair will answer questions. In the days before then, monitor whether gold holds support near $4,395–$4,400 and watch any renewed volatility in hike-odds pricing as incoming data arrives. This summer demonstrated how quickly markets can reprice risk, so traders and investors should prepare for rapid moves in either direction.
Stay on Top of Gold & Silver Prices
Get important market alerts sent straight to your inbox.
SOURCES
1. Federal Reserve — FOMC Minutes, July 28–29, 2026 (FOMC record).
2. Kalshi — market pricing and commentary on September Fed odds (July–September 2026).
3. Prediction market and exchange reports summarizing odds shifts in late July through early September 2026.
4. Gold and silver price references based on market levels in January and September 2026.
Disclaimer: This article is for informational purposes only and does not constitute investment advice. Past performance is not indicative of future results. Consult a qualified financial advisor before making investment decisions.
You may also like:
- Gold ETFs Just Pulled In $2 Billion. Silver Investors Pulled Out.
- Gold/Silver Ratio September 2026: What a 12‑Week Round Trip Is Telling Holders
- Gold Is Falling Today. Four Other Signals Say the Hard‑Assets Trade Isn’t.
- Gold Is Falling for a Reason Most Investors Have Backwards
- Even Central Banks Don’t Trust Someone Else’s Vault Anymore
- Gold’s Dip Below $4,400 Didn’t Scare Wall Street. Here’s Why.
- China Just Broke Its Own Gold‑Buying Record. Then Broke It Again.
Popular Topics
Picked from the archive
-
01
 Topics
Federal Reserve Goes Silent: Why Gold Investors Don’t Need It
-
02
Topics
Goldman Cuts Gold Target, JPMorgan Holds: $1,400 Gap Explained
-
03
Topics
PMI Beat Moves Gold Price Two Ways: Markets Priced Only One
-
04
Topics
How to Spot Fake Gold and Silver: Key Tests and Warning Signs
-
05
Topics
Deutsche Bank Identifies Gold Price Floor: Surprise Buyers
-
06
Topics
Gold Pullback Driven by Treasury Buyback, Not ETFs
-
07
Topics
Dollar Devalued 87% Since 1971: Why Central Banks Buy Gold
-
08
Topics
Prediction Market Files to Let Gold Trade 24/7 Forever