Bank Cuts Silver Price Target 30% — The Real Reason Isn’t the Fed
Last verified: October 2026
In August 2026 J.P. Morgan reduced its fourth-quarter silver forecast from $90 to $63 per ounce. That revision had little to do with interest rates and much to do with changing demand from the solar industry. Two months later, market prices and related indicators have mostly validated that rethink.
As of late October 2026, silver trades near $53.91 per ounce and gold near $4,014.24. That makes the gold-to-silver ratio about 74.4 ounces of silver per ounce of gold — a useful lens through which to view competing forecasts.
What changed in J.P. Morgan’s silver forecast?
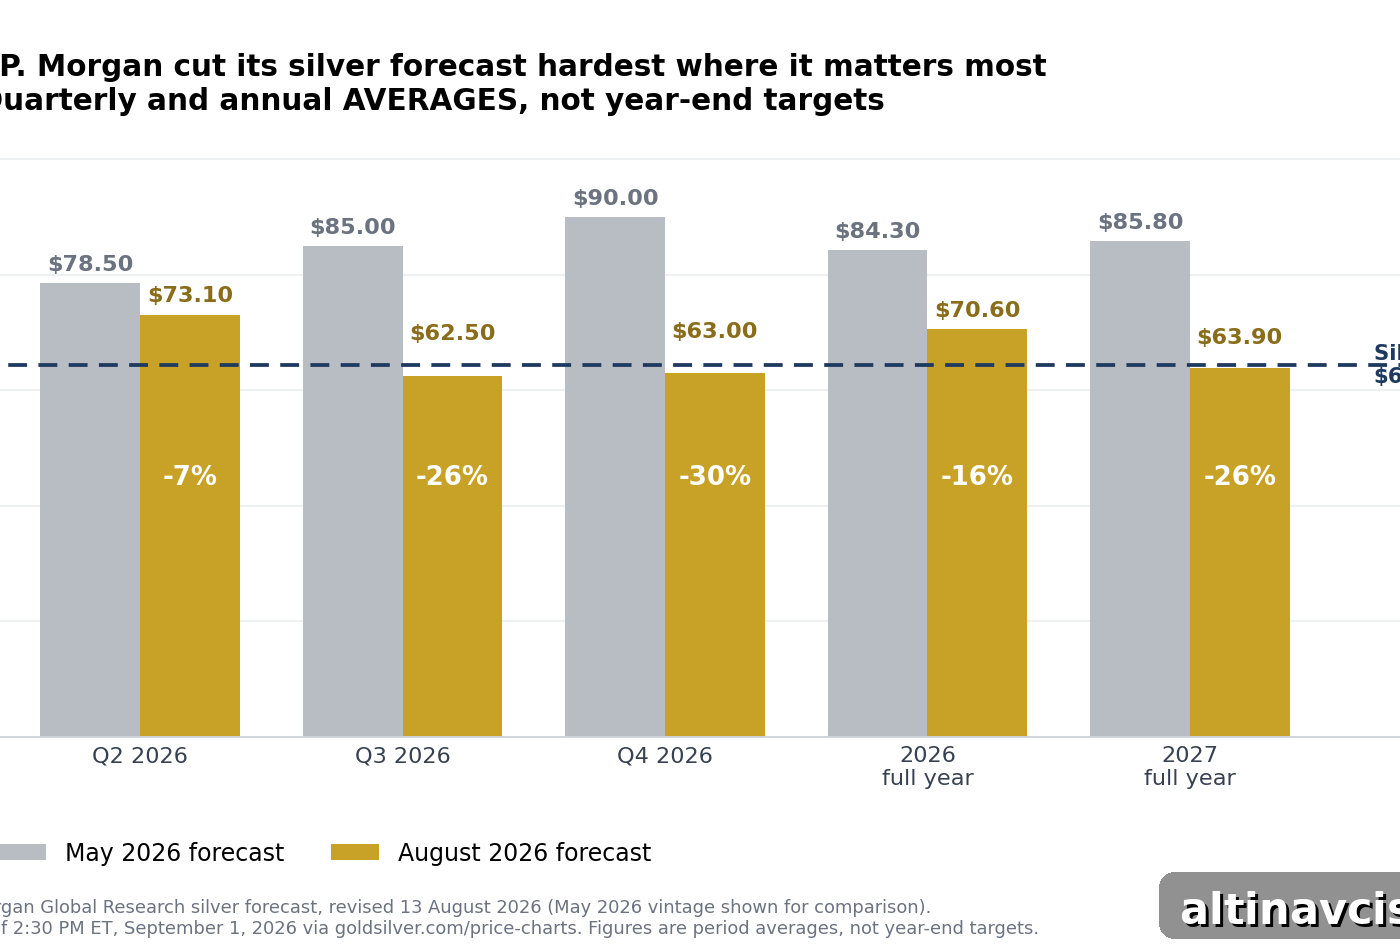
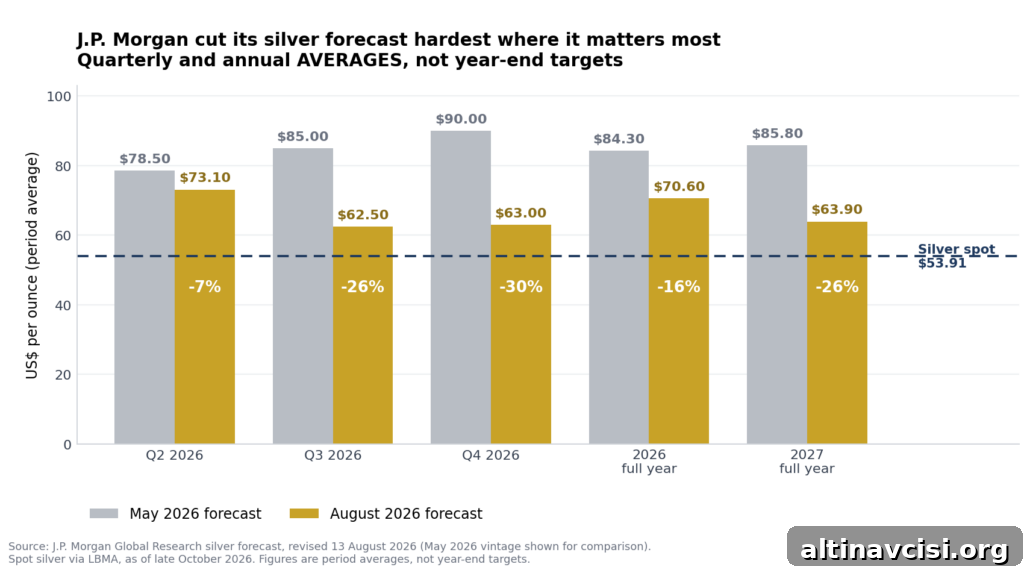
On August 13, 2026, J.P. Morgan Global Research revised its quarterly and full-year silver averages, cutting several outlooks substantially. Below is the bank’s table of average price forecasts by period before and after the August revision.
| Period | May 2026 | August 2026 | Change |
|---|---|---|---|
| Q2 2026 | $78.50 | $73.10 | −7% |
| Q3 2026 | $85.00 | $62.50 | −26% |
| Q4 2026 | $90.00 | $63.00 | −30% |
| 2026 full year | $84.30 | $70.60 | −16% |
| 2027 full year | $85.80 | $63.90 | −26% |
All figures are quarterly and annual averages, not year-end targets. Source: J.P. Morgan Global Research, August 13, 2026.
Why does the basis label matter?
Averages matter because they mix past and future. A 2026 full-year average near $70.60 looks higher than a mid-October spot near $64, but much of that year’s average had already been earned in the first quarter, when silver averaged about $83.70. The forward-looking number investors should watch is the Q4 average, here $63.00.
Also note the pattern in the cuts: Q2 was trimmed modestly, while later quarters were cut far more. That indicates J.P. Morgan updated its view of future demand rather than simply matching a lower spot price.
If not the Fed, what caused the cut?
Higher interest rates do influence precious metals because they raise the opportunity cost of holding non-yielding assets. Gold benefited from structural buyers such as central banks; silver lacks that same steady institutional demand. Still, rate moves alone do not explain the size of J.P. Morgan’s revision. The main driver was a projected drop in solar-related silver demand.
How big is the solar demand decline?
J.P. Morgan’s analyst Gregory Shearer estimated photovoltaic silver demand could fall by around 30% in 2026, roughly 60 million ounces. Silver in solar panels is a conductive paste and represents a material cost. When silver prices rose, manufacturers undertook “thrifting” — reducing silver per panel and substituting alternatives where possible.
Two policy shifts accelerated this trend. Chinese buyers front-loaded imports before April 1, when an export VAT rebate on photovoltaic products was removed, creating a temporary stockpile that has been worked down. India increased effective import duties on bullion in May 2026, raising the cost of bullion imports and weighing on demand. The result: more panels can be installed with less silver per unit.
So record solar deployment does not automatically mean higher silver demand. If panels use substantially less silver, installations can rise while total silver consumption falls.
Is the demand loss bigger than the shortage?
The Silver Institute’s World Silver Survey 2026 projects a 2026 market deficit of about 46.3 million ounces — the sixth consecutive annual shortfall. Put alongside Shearer’s estimated 60 million ounce drop in solar demand, the forecasted industrial demand reduction could exceed the deficit figure.
But you cannot simply subtract one headline from the other. The Silver Institute already factors some thrifting and substitution into its deficit estimate. The real takeaway is this: both institutions agree solar demand is falling; they differ on how much. That single variable can determine whether a sixth consecutive deficit actually materializes.
Can you test which view is right?
Yes. The difference resolves in import flows from major buyers, disclosed panel silver-loading figures, and industry destocking patterns. Those data points are more informative for silver’s physical balance than central bank commentary or rate forecasts.
What does the gold-silver ratio say about silver?
Converting price calls into a gold-silver ratio clarifies many forecasts. The ratio measures how many ounces of silver it takes to buy one ounce of gold. In late January, the ratio fell below 45 at silver’s peak; by late October it had widened to about 74.4 — close to J.P. Morgan’s 2027 ratio target and well above the modern-era averages many analysts cite.
J.P. Morgan’s August view was that the ratio would move toward 70 in the second half of 2026 and toward 75 in 2027, implying silver underperformance relative to gold. That is exactly the pattern observed since the revision: silver did not collapse, but it lagged gold.
Is silver’s next buyer monetary or industrial?
This is the central question. If monetary buyers — investors, central banks, bars and coins — become the marginal demand source, the ratio compresses and silver outperforms. If industrial demand continues to shrink, the ratio widens and silver underperforms. About half of silver demand is industrial (electronics, solar, EVs, medical), so the metal must clear both monetary and industrial demand curves simultaneously, which explains its wide forecast range.
What could break the bearish case?
Two developments could have overturned J.P. Morgan’s thesis; one has been resolved and the other remains open. India has not reversed its increased import duty, which continues to support the bearish case for industrial demand. The open question is whether physical investment demand — coins and bars — will absorb the metal that industrial buyers release. If investment demand strengthens enough, it could offset shrinking industrial consumption.
Why does silver storage matter?
Silver used in solar panels is consumed and effectively removed from the tradable stock. Silver purchased as bars or coins remains available and can be stored indefinitely. If the marginal buyer shifts toward storage rather than consumption, the market’s available float depends on storage arrangements and allocation terms, which can create tightness even if annual mine supply is unchanged. The October 2025 London squeeze illustrated how availability and lease terms can create price pressure when stored metal becomes hard to access.
Is every kind of silver exposure the same?
No. Ownership structure matters. Exchange-traded funds provide price exposure but may not guarantee physical delivery. Allocated, vaulted holdings give you a claim you can take possession of. If you are acting on the deficit thesis, holding physical metal under secure storage terms matters more than simply holding a claim on paper.
So what is the silver price prediction for 2026?
Forecasts vary widely. The structure of the disagreement is more durable than any single number:
- Base case: J.P. Morgan’s revised outlook implies Q4 averages around $63 and a widening gold-silver ratio toward 70–75, meaning silver underperforms gold.
- Bull case: Requires a meaningful compression of the gold-silver ratio driven by strong monetary demand; that demands investors and collectors absorb the metal industrial markets release.
- Decisive factor: The size of the solar demand decline — not Fed statements or a headline deficit figure.
- Watch: Chinese and Indian import flows, panel silver-loading disclosures, and whether India’s import duty changes.
In May 2026, some professional teams expected Q4 silver averages near $90; by August the same teams revised to $63. Treat forecasts as statements of current belief, not guarantees. Monitor physical demand indicators and storage availability to adjudicate between competing scenarios.
SOURCES
1. J.P. Morgan Global Research — The Path for Silver Prices in 2026 and 2027 (August 13, 2026)
2. Silver Institute / Metals Focus — World Silver Survey 2026 and related commentary
3. Bloomberg, CNBC and other industry reports covering silver market balance and policy changes in 2026
4. Industry analysis and market price data referenced in April–October 2026 reporting
Disclaimer: This article is for informational purposes only and does not constitute investment advice. Past performance is not indicative of future results. Always consult a qualified financial advisor before making investment decisions.
You May Also Like:
- Will Gold Go Down for the Rest of 2026? Six Banks Cut Their Targets, and the Cuts Trailed the Price
- SLV Holds Your Silver. It Just Can’t Give It Back to You.
- What Are the IRS Rules for a Precious Metals IRA in 2026?
- Why Your Pension Can Own Gold and Your 401(k) Still Can’t
- Ten Percent Sent Gold Abroad. Nine Percent Brought It Home.
People Also Asked
The most recent major bank revision projects roughly flat to slightly lower silver into Q4 2026, with a fourth-quarter average near $63. The bull case is for higher prices but requires strong monetary demand to offset industrial declines.
Mainly because of expected declines in photovoltaic silver demand. Analysts estimate manufacturers are reducing silver loading per panel and substituting materials, and recent policy changes accelerated that shift. Higher interest rates are a secondary factor.
No. The 2026 industry survey projects a sixth consecutive annual deficit, though the duration and size of deficits depend on how industrial demand evolves.
The ratio has widened from sub-45 at silver’s peak to the low-to-mid 70s by October 2026, implying silver has underperformed gold and aligning with forecasts that expect further ratio widening through 2027.
Roughly half of annual silver demand is industrial, spanning electronics, solar, electric vehicles and medical uses, which is why silver behaves both as a monetary metal and a commodity tied to manufacturing.
Yes. Physical possession, allocation and storage terms matter in a squeeze. Price exposure via funds is not the same as holding allocated, deliverable metal.
Popular Topics
Picked from the archive
-
01
 Topics
Can Silver Outpace Gold in a Bull Market?
-
02
Topics
COMEX Silver Coverage Ratio: Is Your Paper Silver Genuine?
-
03
Topics
Gold Price: What Could Drive It to $6,300?
-
04
Topics
5-Year Silver Price Forecast: Data-Driven Scenarios
-
05
Topics
187,000 Jobless Claims: How the 2026 Low Impacts Gold
-
06
Topics
Bank of America Forecasts 3 Rate Hikes; Silver Prices In First
-
07
Topics
BLS Revises April Jobs: +64,000 Then -31,000; Gold Reacts
-
08
Topics
Is Gold Jewelry a Smart Investment? Common Buyer Mistakes