Why HSBC Says Gold Will Hit $4,750 by Year-End
Key Takeaways
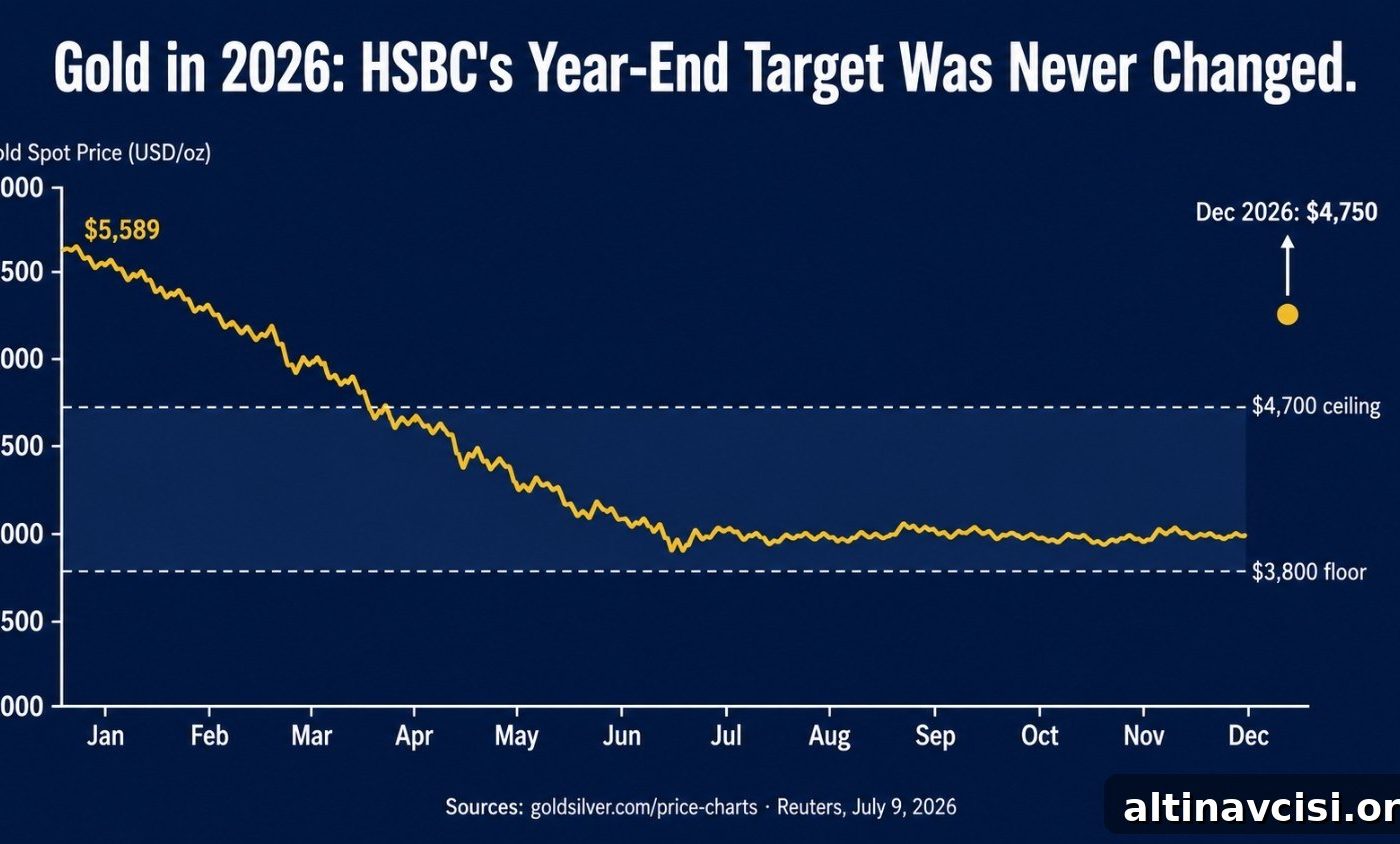
- On July 9, 2026, HSBC lowered its 2026 average gold forecast from $4,864 to $4,560 but kept its year-end target at $4,750. The difference between the reduced average and the unchanged year-end target is the main signal.
- The structural drivers behind gold’s 2024–2025 rally — sovereign de-dollarization, widening fiscal deficits, and central bank purchases exceeding 800 tonnes per year — remain unchanged in HSBC’s updated outlook.
- Central banks added 244 tonnes of gold in Q1 2026 — up 3% year-over-year and above the five-year quarterly average — even while prices traded near historic highs. [World Gold Council]
- The gold-to-silver ratio sits near 70:1, above its 50-year average of about 65, while silver is headed into a sixth consecutive year of supply deficit. [Silver Institute]
- For long-term physical metal holders, short-term events such as the July 28–29 FOMC meeting are noise; the structural case for precious metals depends on longer-term fiscal and monetary dynamics.
Sources: goldsilver.com/price-charts | Reuters (HSBC forecasts, July 9, 2026)
The headline from HSBC on July 9, 2026, looked concerning at first glance. James Steel, HSBC’s Chief Precious Metals Analyst, cut the bank’s 2026 average gold forecast to $4,560 from $4,864 — a $304 reduction. At the same time, spot gold was trading near $4,000, about 28% below its January all-time high of $5,589.38.
Crucially, however, HSBC left its year-end target unchanged at $4,750. That difference between the lowered average and the steady year-end projection is more meaningful than the initial headline cut.
HSBC also kept its central bank demand forecast for 2026 at 680 tonnes and left the 2027 year-end target at $5,025. Projections for 2028 and 2029 remained at $5,200 and $5,300 respectively. In other words, while the bank acknowledged near-term pressure on prices, its medium-term view did not change.
Why Do Rising Treasury Yields Push Gold Lower?
To grasp HSBC’s rationale, it helps to understand the temporary headwind the bank is describing. Gold pays no interest, so when US Treasury yields rise, the opportunity cost of holding non-yielding assets increases. As of July 20, 2026, the 10-year US Treasury yield was around 4.57%, and inflation expectations near 2.3% imply a positive real yield above 2%. That environment works against metals that offer no yield.
A stronger dollar amplifies this effect. Higher US rate expectations attract capital into dollar-denominated assets, driving the dollar higher and making dollar-priced gold more expensive for international buyers. HSBC analysts Willem Sels and Lucia Ku explicitly noted that US yields are a primary driver of near-term gold price action and suggested gold could remain range-bound while real yields and the dollar stay elevated.
Still, HSBC argues these forces are already priced in. The bank expects gold to trade between $3,800 and $4,700 for the remainder of 2026, and spot gold was near the middle of that band when the note was published. In other words, HSBC is signaling where it sees the floor, not predicting a further collapse.
The precedent from 2022 supports that view: gold held above $1,800 even as the Federal Reserve ran its most aggressive tightening cycle in decades, with real yields moving from deeply negative to meaningfully positive. Central bank purchases helped absorb institutional selling, a dynamic that appears to be repeating now.
The Knowledge That Changes Everything

Two concise guides — free to download. Learn why gold matters and why fiat currencies have historically failed.
Why Are Central Banks Still Buying Gold at These Prices?
The headlines have focused on who is selling, but the more consequential story is who continues to buy. Central banks added a net 244 tonnes of gold in Q1 2026, exceeding prior quarters and the five-year quarterly average, according to the World Gold Council. Sovereign buyers kept accumulating even as prices traded near record levels — behavior consistent with long-term reserve diversification rather than short-term trading.
A June 2026 WGC survey showed 45% of central banks planned to increase their gold holdings over the following 12 months. These institutions issue fiat currency and manage national reserves; their decision to hold gold reflects a strategic, multi-year allocation against monetary and systemic risk.
Importantly, HSBC did not cut its central bank demand forecast when it lowered its 2026 average price. It retained a call for 680 tonnes in 2026 and 850 tonnes in 2027. That continuing demand from sovereign buyers acts as a structural price support that is largely uncorrelated with equity sentiment or interest-rate expectations. When institutional paper-gold selling occurs, sovereign and retail physical demand can absorb the supply.
Retail demand in Asia has also remained robust. China’s gold ETF inflows led global ETF demand in the first half of 2026, helping drive $8 billion in net global gold ETF inflows during H1, even as North American funds experienced outflows. The net effect is that physical metal is migrating from Western exchange vaults into domestic reserves and Asian retail hands, tightening the supply available to global paper markets.
What Does HSBC’s $4,750 Year-End Target Actually Tell You?
This is the part many readers missed. HSBC lowered its 2026 average but held the year-end target at $4,750. For traders and mining CFOs focused on quarterly realized prices, the average matters. For long-term owners of physical gold, the year-end target is the more relevant guide.
James Steel said the second-half recovery could be driven by structural supports reasserting themselves, including widening fiscal deficits and ongoing sovereign debt market pressures. He also suggested that heavy ETF liquidation in the first half of 2026 might partially reverse as institutional and sovereign demand rebalances. HSBC characterized some geopolitical headwinds as cyclical rather than permanently price-damaging.
HSBC even noted in a late-June commentary that gold was beginning to look undervalued. Taken together, the unchanged year-end target and that language imply the bank views the correction as a repositioning opportunity, not a reversal of the structural bull market.
For a physical-gold investor, that distinction matters: a paper-gold trader may focus on the next Fed meeting; a stacker caring about five-year purchasing-power protection is more interested in whether the structural case for metals still holds. According to HSBC’s unchanged year-end projection, it does.
Why Is the Gold-Silver Ratio at 70:1 a Signal, Not a Warning?
Silver has lagged gold significantly during this correction. The gold-to-silver ratio — the ounces of silver needed to buy one ounce of gold — rose from around 55:1 in May 2026 to about 70:1. That divergence reflects distinct demand drivers for the two metals.
Roughly 58% of silver demand is industrial, according to the Silver Institute. Silver is essential for solar panels, electric vehicles, semiconductors and data-center components. When investors worry that tighter monetary conditions will slow growth, silver’s industrial-demand outlook weakens alongside equities. Gold, on the other hand, is driven mainly by monetary demand and does not depend on industrial growth.
The divergence is cyclical, not structural. The Silver Institute projects a sixth consecutive annual silver supply deficit in 2026; cumulative above-ground drawdowns since 2021 total many hundreds of millions of ounces. Historically, a gold-silver ratio above the long-run average indicates relative undervaluation in silver and has tended to compress sharply when monetary conditions ease and industrial demand recovers. The key unknown is timing, not the eventual direction.
What Should a Long-Term Stacker Do Right Now?
Your decision depends on your investment horizon. If you are a short-term trader betting on the outcome of the July 28–29 FOMC meeting or the next economic print, this analysis does not change that tactical calculus. Timing remains uncertain.
If you are a long-term physical metals holder seeking 3–5 year purchasing-power protection, the present environment offers a methodical accumulation opportunity. Gold near $4,000 is materially below its January high, while the structural drivers — central bank buying, rising sovereign debt burdens and geopolitical fragmentation — remain in place. Dollar-cost averaging across the consolidation period is a prudent, risk-managed way to build a position rather than trying to pick a single bottom.
The widely expected outcome for the late-July FOMC meeting is a hold. Even if rates remain unchanged, the structural dynamics that limit sustained aggressive tightening — notably fiscal pressures and Treasury market constraints — remain. HSBC’s analysts highlight diversification demand, central bank purchases and steady ETF inflows as medium-term supports for gold.
This is not an explicit buy recommendation; it is a restatement that the structural case for gold and silver remains intact. For investors who already understand why they hold physical metal, the message is to stay the course and use consolidations to add to positions prudently.
Stay On Top of Gold & Silver Prices
Get important market alerts sent straight to your inbox.
People Also Ask
On July 9, 2026, HSBC revised its 2026 average gold forecast to $4,560 per ounce, down from $4,864, but retained a year-end target of $4,750 and a 2027 year-end target of $5,025. The bank expects gold to trade in a $3,800–$4,700 range for the remainder of 2026 before closing nearer its year-end target. Longer-term forecasts for 2028 and 2029 remained unchanged.
Near-term pressure on gold comes from higher US real yields — which raise the opportunity cost of holding non-yielding assets — and a stronger dollar, which makes dollar-priced gold more expensive internationally. These cyclical forces can outweigh structural demand in the short term, even while central banks continue to accumulate physical gold, providing a longer-term price floor.
A ratio around 70:1 exceeds the long-run average and historically corresponds to periods when silver is relatively undervalued versus gold. With several consecutive annual supply deficits and large cumulative drawdowns in above-ground stocks, the structural case for silver remains intact, though a precise timing trigger for ratio compression is uncertain.
If your objective is long-term purchasing-power protection, corrections within a structural bull market often provide favorable entry points. Dollar-cost averaging across multiple price levels reduces timing risk. Short-term traders focused on macro events will need to weigh Fed policy, economic data, and geopolitical developments when deciding whether to enter.
The Second Corner: What the Mainstream Is Missing
Much of the mainstream narrative in mid-2026 casts gold’s correction as proof the bull market is over: the record peak was in January, the correction has been sharp, and the Fed remains hawkish. That reading misses the deeper structural picture.
Gold’s rise from roughly $2,600 in late 2024 to the January 2026 peak was driven not only by low rates but by a multi-year reassessment of monetary risk. Central banks set a modern record for annual gold purchases in 2022 and have sustained purchases above 800 tonnes each year since — far above pre-2022 norms. Sovereign debt levels have grown to the point where prolonged aggressive tightening becomes fiscally and politically difficult.
Those structural realities have not been reversed: central banks continue to buy, silver remains in multi-year deficit, and fiscal pressures persist. The current headwinds are primarily cyclical. Historically, cyclical pullbacks reconcile with the structural case over time, and investors who add to physical metal during consolidations typically secure more attractive entries.
SOURCES
1. Reuters via Yahoo Finance — HSBC cuts 2026-27 gold price forecasts on hawkish Fed tilt, July 9, 2026
2. World Gold Council — Gold Demand Trends Q1 2026, April 29, 2026
3. World Gold Council — Gold ETF Flows, June 2026
4. Silver Institute — World Silver Survey 2026, April 15, 2026
5. FXStreet — HSBC: Gold range-bound near term, upside later, July 1, 2026
6. MacroMicro — US 10-Year Treasury Yield, July 20, 2026
7. GoldSilver — HSBC cut its gold forecast by $304; said gold will hit $4,750 by year-end, July 10, 2026
8. ExchangeRates.org.uk — HSBC says sell-off may be nearing an end, June 30, 2026
Disclaimer: This article is for informational purposes only and does not constitute financial or investment advice. Consult a qualified financial adviser before making investment decisions.
You May Also Like:
- State Street Predicts $5,500 Gold by Q1 2027: Is the Dip Over?
- Why China’s Gold Buying Spree Outweighs India’s Pause
- What Is Purchasing Power — and Why Every Dollar You Save Is Slowly Being Taxed Away
- Why Hong Kong? Inside Offshore Gold Storage Networks
- Silver Price Outlook July 2026: Two Catalysts, One Setup
- Why the 10-5-3 Rule Fails Gold and Silver Investors
- Why Is Silver So Hard to Mine? The Primary Supply Problem Explained
Popular Topics
Picked from the archive
-
01
 Topics
Key Indicator to Watch for Gold Ahead of Fed Decision
-
02
Topics
Gold and Silver Correction: Is the 2026 Bull Market Ending?
-
03
Topics
Inflation Holds at 3.0%, Gold Funds Post Historic Rally
-
04
Topics
China Ends Paper Gold Trading July 24: Why Physical Holders Win
-
05
Topics
Why Turkey Sold Its Gold and What It Means for Sound Money
-
06
Topics
Gold-to-Silver Ratio Hits 64: What It Means for Silver in 2026
-
07
Topics
Physical vs Digital Gold: Which Is the Safer Investment?
-
08
Topics
Gold Prices Surge: The Unexpected Reason