Silver Drops 1.4% as Gold Holds; Ratio Reaches 70:1
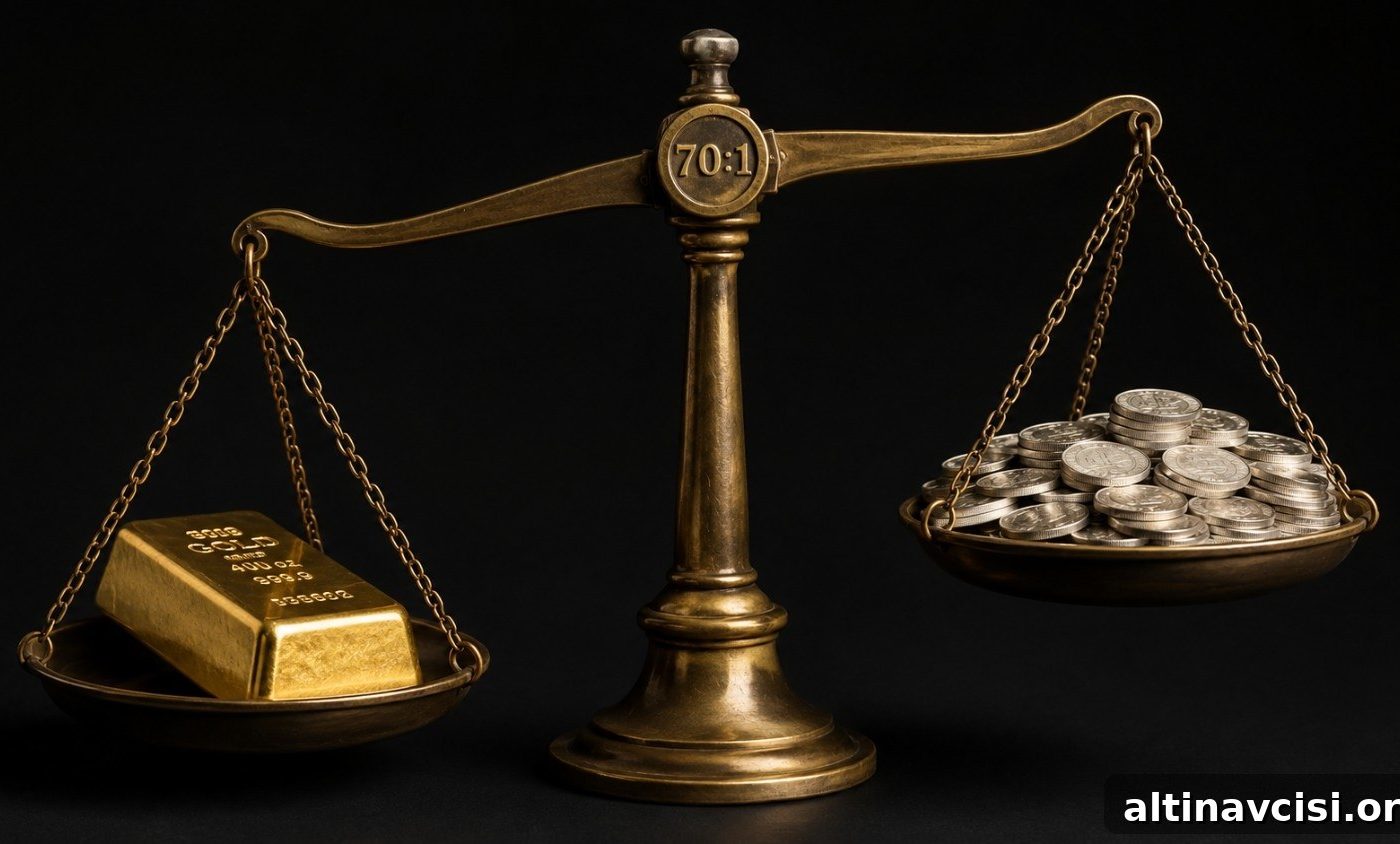
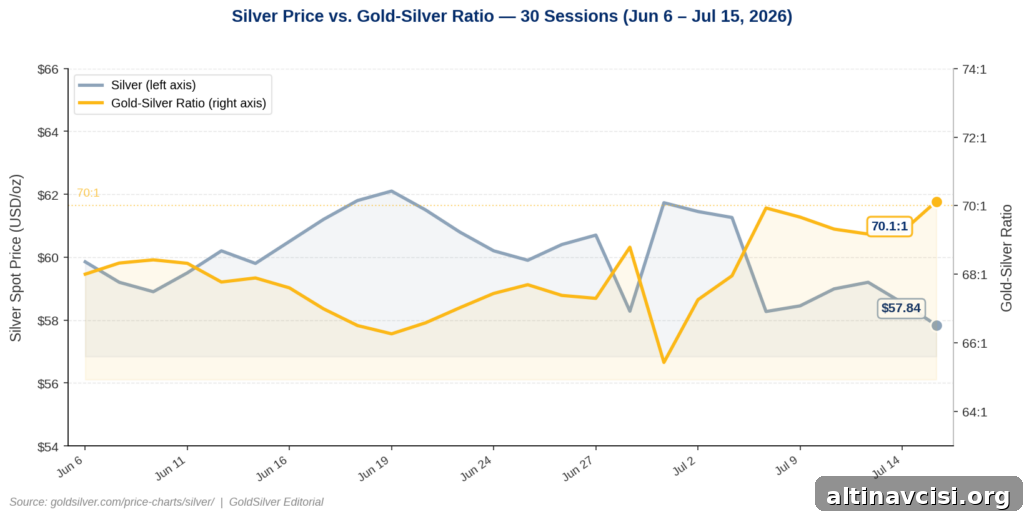
Gold and silver normally move in tandem, but today they diverged. Gold finished essentially unchanged, up by less than a tenth of a percent, while silver fell 1.4% to $57.84 an ounce. That pushed the gold-silver ratio to about 70:1 — meaning one ounce of gold now buys more than 70 ounces of silver — a level near the high end of its two-year range.
Why Does the Gold-Silver Ratio Matter for Investors?
The gold-silver ratio shows how many ounces of silver are required to buy one ounce of gold. With gold quoted near $4,056 and silver at $57.84, the ratio sits around 70:1. Historically this ratio has swung widely — roughly 30:1 at the tightest and as much as 127:1 at extreme widening, the latter seen during the March 2020 panic. A 70:1 reading is not unprecedented, but it indicates silver has meaningfully lagged gold and that different forces are currently affecting each metal.

The Edge Every Investor Needs
Smarter precious metals investing starts here. The Nuggets Newsletter delivers market insights, Fed updates, global trends, and educational content to help you make informed decisions.
What Is Driving Silver’s Underperformance Today?
Silver is driven by two distinct demand engines: industrial use and monetary/investment demand. According to the Silver Institute’s World Silver Survey 2026, roughly 58% of silver demand is industrial — used in solar panels, semiconductors, electric vehicles and medical devices. That industrial exposure links silver to global economic growth; when investors fear higher rates will slow growth, silver’s industrial demand outlook weakens.
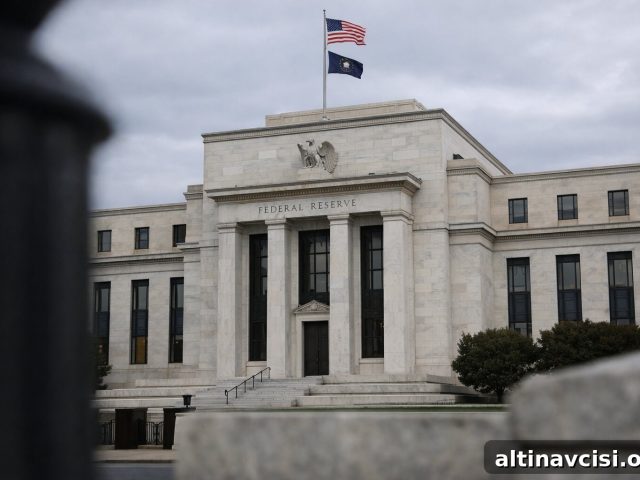
That dynamic explains the current divergence. The Federal Reserve’s rate path remains uncertain ahead of the July 28–29 FOMC meeting. Market-implied odds favor a pause in July, but meaningful probability remains for a rate move later in the year. Those lingering uncertainties suppress expectations for industrial demand and weigh on silver even as gold holds steady.
Gold’s primary driver is monetary demand: central bank purchases, institutional allocations and investor hedging against purchasing-power erosion. These motivations are less sensitive to near-term GDP growth. Gold also received a modest boost this week after June CPI and PPI prints surprised to the downside, easing some real-yield pressure. Silver saw the same monetary tailwind, but it lost ground on the industrial side, producing a net decline of 1.4% today.
What Do Analysts Say About Silver’s Setup?
At a 70:1 ratio, many institutional forecasts for silver’s year-end targets remain unchanged. For example, major bank base cases and analyst consensus figures for 2026 still imply silver prices substantially higher than today’s level, which would bring the ratio closer to historical norms if gold remains near current prices. Analysts emphasize that today’s correction reflects a recalibration of timing and risk, not a fundamental change to long-term price targets.
The structural supply picture also supports a stronger case for silver over time. The Silver Institute’s 2026 survey reported a sixth consecutive annual supply deficit of 46.3 million ounces. Since 2021, cumulative above-ground drawdowns total approximately 762 million ounces — nearly nine months of global mine production absorbed by industrial and investment demand. That physical deficit doesn’t disappear because short-term rate expectations shift.
The Real Story Behind the Ratio: Two Signals Running at Once
Today’s split between gold and silver reflects two concurrent economic signals. Gold is signaling softer inflation and easing real yields while the structural bid from central banks and long-term investors remains. Silver is signaling elevated growth uncertainty that could curb industrial demand if rates stay high. The 70:1 spread captures that tension.
Historically, when the ratio widens beyond 70:1, silver has often reclaimed ground quickly once rate and growth uncertainty ease. After the COVID-19 peak in the ratio, silver outperformed gold substantially within months. The dual nature of silver — monetary plus industrial demand — means it can amplify recoveries when growth prospects improve.
Investors who hold physical silver at current ratios are effectively buying an asset priced as if an economic slowdown is likely. That view may prove correct or not, but historically such wide ratios have presented favorable entry points on the monetary side of silver without needing a specific growth scenario to unfold.
What Should Silver Investors Watch Next?
Two near-term dates matter: the FOMC decision on July 28–29 and the June PCE inflation release on July 30, the Fed’s preferred inflation gauge. A July hold combined with a soft PCE print would likely compress the gold-silver ratio, while any clear signal of further tightening would sustain the industrial-demand headwind for silver. Also monitor the 10-year Treasury yield — presently around 4.60% — because a sustained decline in yields would ease real-yield pressure on both metals. Historically, silver has tended to move about 1.5 times the magnitude of gold on the upside.
SOURCES
1. GoldSilver — Live Silver Spot Price, July 15, 2026
2. GoldSilver — Live Gold Spot Price, July 15, 2026
3. Silver Institute — World Silver Survey 2026
4. Bureau of Labor Statistics — Producer Price Index, June 2026, July 15, 2026
5. CME Group — FedWatch Tool, July 2026 FOMC Rate Probabilities
6. Federal Reserve — Semiannual Monetary Policy Testimony, July 14–15, 2026
Disclaimer: This article is for informational purposes only and does not constitute financial or investment advice. Consult a qualified financial adviser before making investment decisions.
You May Also Like:
- Gold Holds as CPI and PPI Both Miss. Here’s Why.
- Gold Is Flat. Oil Is Up 9%. Here’s Why.
- Gold and Fed Policy: When the System Picks Winners
- Warsh Testified. Gold Jumped $90. The Signal Everybody Missed Was in His Report.
- Gold Jumped $90 This Morning. June CPI Just Explained Why.
- Silver Fell 3.8% Today. Gold Fell 2.9%. The Gap Has a Name.
Popular Topics
Picked from the archive
-
01
 Topics
Gold Price Cycles Explained: A Four-Time-Horizon Framework
-
02
Topics
Gold Repricing Underway: 5 Major Institutions Confirm
-
03
Topics
How Dalio, Buffett and Jim Rogers Invest in Gold
-
04
Topics
How Gold Prices Move During a US Dollar Crash
-
05
Topics
5 Factors That Drive Gold Spot Prices
-
06
Topics
August CPI: Sticky Inflation Unlikely to Stop Fed Rate Cuts
-
07
Topics
Institutions Are Buying as Bond Yields Rise: What It Means
-
08
Topics
Why a Stalled Federal Reserve Matters for Gold Prices