Why Silver Mining Is Difficult and What Limits Supply
Key Takeaways
- Only about 26–28% of the silver mined each year is produced by primary silver mines—operations built specifically for silver. The remaining supply is generated as a byproduct from copper, lead, zinc, and gold mining. [Source: Silver Institute / Metals Focus, World Silver Survey 2026]
- Because most silver supply depends on decisions driven by other metals, higher silver prices do not automatically produce significantly more silver. Supply is structurally inelastic.
- The global silver market has posted a deficit for six straight years (2021–2026), drawing down cumulative above‑ground stocks by 762 million ounces according to the World Silver Survey 2026. [Source: Silver Institute]
- Sinda Ltd. (NYSE: SIND), a new primary silver developer, raised about $323 million in June 2026 with strategic backing from Fresnillo plc. It aims for first production by 2031, a relatively fast schedule by industry standards. [Source: Business Wire / Sinda Ltd. IPO filing]
- Developing a new primary silver mine generally takes at least 7–10 years and often more. S&P Global’s July 2026 analysis shows average lead times closer to 16 years for operating mines and nearly 30 years for non‑operating assets in the feasibility pipeline. No large new primary mine starting development today can close this decade’s supply gap. [Source: S&P Global Market Intelligence]
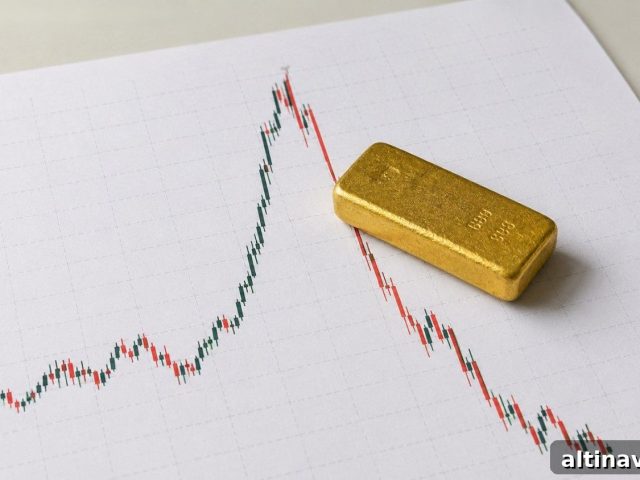
- Silver hit an all‑time high of $121.62 in January 2026 and corrected to roughly $57–60 by July 2026, yet the structural supply shortfall that fueled the rally remains unresolved.
Global silver demand exceeded supply in 2025 for the fifth year in a row, and forecasts for 2026 point to a sixth consecutive deficit. While demand drivers—industrial uses, solar, electric vehicles, and investment—are important, the persistent shortfall is primarily a supply‑side problem: silver’s production structure prevents a timely response to rising prices.
For long‑term investors, distinguishing between short‑term price volatility and long‑term structural trends is essential. Price spikes and pullbacks are noisy; the underlying supply imbalance is the key signal.
Why Does Only a Small Fraction of Silver Come from Primary Mines?
Silver is widely used across industries, but it rarely justifies a mine on its own. The Silver Institute and Metals Focus report that roughly 26% of global silver output in 2025 came from primary silver mines—those built and financed primarily for silver. The majority, about 74%, is a byproduct from mines targeting other metals such as lead, zinc, copper, and gold. That means most silver production exists because another metal made the project viable, not because silver itself did.
Lead and zinc operations alone accounted for roughly 29% of global silver output in 2024, making them the largest combined source. Copper and gold operations also contribute significant byproduct silver. In each case, planning, permitting, and capital allocation are focused on the base metal, with silver as a secondary revenue stream.
Why silver prices don’t automatically call more silver into existence
This byproduct structure creates an asymmetry in how silver supply responds to price. A copper or zinc mine evaluates expansion based on copper or zinc economics: reserves, prices, and market forecasts. Silver appears as a revenue credit and is rarely decisive. Doubling the silver price does not make a byproduct operation produce double the silver—its output is constrained by the host metal’s ore body, processing capacity, and mine plan. The typical market mechanism—higher prices attract more supply—is therefore muted for silver.
The Knowledge That Changes Everything

Two essential guides — free. Learn why gold matters and the risks long-term investors face with fiat currencies.
How Does the Byproduct Structure Affect Supply During a Deficit?
When demand outstrips supply, prices typically rise and eventually incentivize new production. For silver, that feedback loop is impaired in two ways. First, most silver supply is controlled by decisions about other metals, so demand signals for silver often do not reach the parties who control most production. Second, even for the minority of projects that are dedicated to silver, development is slow: from discovery through permitting and construction, a primary silver mine usually needs many years before producing metal.
A conventional primary silver development takes a minimum of 7–10 years in optimistic scenarios. In practice, S&P Global’s July 2026 analysis shows average lead times of about 16 years for operating mines and nearly 30 years for non‑operating assets in the feasibility stage, driven largely by permitting delays. The consequence: even a strong price signal today cannot generate meaningful new primary silver supply for many years.
What S&P Global’s data shows about mine lead times
S&P Global’s research highlights a dramatic lengthening of mine lead times compared with prior decades. Projects now face more regulatory scrutiny, community engagement requirements, and environmental reviews, which lengthen permitting and approval processes. These delays push average discovery‑to‑production timelines well beyond the expectations many investors still hold.
For physical silver holders, the practical takeaway is clear: ounces needed this decade either already exist in stocks above ground or they will not be mined until the next decade or later.
What Does the Sinda IPO Reveal About Primary Silver Scarcity?
In June 2026 Sinda Ltd. listed on the New York Stock Exchange and raised approximately $323 million through an IPO and a private placement. Fresnillo plc, the world’s largest primary silver producer, committed up to $110 million and took roughly a 5% stake. Franco‑Nevada participated as an anchor investor. Sinda is a pre‑revenue developer targeting first production by 2031; it has not yet produced any silver. Proceeds are intended for drilling, underground development, and studies. [Source: Business Wire; Sinda Ltd. IPO filing]
Fact one: Sinda has never produced an ounce
Sinda reported losses in 2025 and early 2026 and holds inferred and indicated resource estimates rather than proven reserves. The company is funding exploration and development with the IPO proceeds and aims for production in the early 2030s if development and permitting progress smoothly.
Fact two: the world’s largest primary silver producer invested anyway
Fresnillo’s investment in a pre‑revenue developer signals how industry incumbents view future supply. The company is not betting on current price momentum but on the long‑term scarcity of high‑quality primary silver deposits. Large, standalone primary silver assets are rare, and strategic capital is moving to secure those opportunities well before any new production appears.
Why Does the Six-Year Silver Deficit Keep Getting Worse?
The World Silver Survey 2026 reported a 40.3 million ounce deficit in 2025, continuing an ongoing shortfall. The 2026 forecast expected a 46.3 million ounce deficit, extending the consecutive‑year streak. From 2021 through 2026 the cumulative drawdown on above‑ground stocks reached approximately 762.1 million ounces—close to a full year of global mine production consumed over five years. [Source: Silver Institute / Metals Focus, World Silver Survey 2026]
2026 projected deficit
46.3 Moz
Consecutive deficit years
6
Cumulative drawdown
762 Moz
| Year | Annual deficit (million oz) |
|---|---|
| 2021 | 75.0 |
| 2022 | 237.7 |
| 2023 | 168.9 |
| 2024 | 140.3 |
| 2025 | 40.3 |
| 2026 (forecast) | 46.3 |
Source: Silver Institute / Metals Focus — World Silver Survey 2026 (April 15, 2026)
Why higher prices didn’t close the gap in 2025
In 2025, mine production rose by about 3% to 846.6 million ounces and recycling reached a 12‑year high of 197.6 million ounces, yet demand totaled 1.13 billion ounces. The byproduct structure limited how much additional silver mining could respond to higher prices, so the market still ran a substantial deficit. Forecasts for 2026 expected modest declines in mine production and modest increases in recycling, but not enough to eliminate the shortfall.
Industrial demand comprised about 58% of total silver consumption in 2025. While solar manufacturers continue to reduce silver content per panel (a process known as thrifting), rising demand from electric vehicles, data centers, and grid expansion offsets some of those savings. The result is a persistent structural deficit that price moves alone cannot quickly solve.
What Does the Silver Supply Problem Mean for Long-Term Investors?
Two reinforcing realities shape the long‑term outlook for silver. First, about three‑quarters of silver supply is a byproduct tied to other metals, making supply largely inelastic to silver price changes. Second, any new primary silver projects that could respond to higher prices face long development lead times—often a decade or more. That combination makes a near‑term structural shortage likely to persist until a meaningful pipeline of large primary projects reaches production.
The Sinda transaction illustrates this dynamic: major industry players are committing strategic capital to secure future primary ounces because new large-scale primary silver deposits are rare and slow to bring into production. A one‑day price spike is very different from an industry decision to allocate hundreds of millions to secure future supply.
For owners of physical silver, the meaningful question is not short‑term price direction but how the market’s supply structure will evolve over the next decade. Temporary macroeconomic pressures—central bank policy, currency moves, geopolitical tensions—can depress prices for months or even years. But they do not change the multi‑decade timeline required to add significant primary supply.
Stay On Top of Gold & Silver Prices
Receive concise market updates and alerts by email.
People Also Ask
Why is there a silver supply shortage?
The shortage arises from two structural issues. First, roughly 74% of silver is produced as a byproduct of other metals, so its supply responds to the economics of those host metals rather than to silver demand. Second, primary silver projects that could be responsive take many years to develop. Together, these constraints have produced consecutive annual deficits and a substantial drawdown of above‑ground stocks since 2021. [Source: Silver Institute / Metals Focus]
What percentage of silver comes from primary silver mines?
About 26–28% of global silver production comes from primary silver mines. The remainder is produced alongside base metals and gold. Lead and zinc operations are the largest single collective source of byproduct silver. [Source: Silver Institute / Metals Focus]
How long does it take to build a new silver mine?
Optimistic estimates for a primary silver project range from 7 to 10 years from discovery to first production. Real‑world averages are longer: S&P Global’s July 2026 analysis found an average lead time of about 16 years for operating mines and nearly 30 years for non‑operating projects in the feasibility pipeline. Permitting and community engagement have been major contributors to these extended timelines. [Source: S&P Global Market Intelligence]
Why can’t miners just produce more silver when prices are high?
Most silver cannot be increased independently because it is a byproduct of mines optimizing for other metals. A copper mine’s expansion decisions are rooted in copper economics, not in silver prices. Even dedicated silver projects take years to develop. As a result, silver supply behaves as highly inelastic relative to price, unlike many other commodities.
What does a silver mining IPO tell us about supply scarcity?
Sinda’s June 2026 IPO, backed by Fresnillo and other strategic investors, illustrates industry recognition of long‑term primary silver scarcity. Investment in pre‑production assets reflects a belief that acquiring future ounces is necessary because the current development pipeline cannot quickly replace the structural deficit. [Source: Business Wire; Sinda Ltd. IPO filing]
SOURCES
1. Silver Institute / Metals Focus — World Silver Survey 2026, April 15, 2026
2. Silver Institute — Global Silver Investment to Remain Strong in 2026: Sixth Consecutive Annual Market Deficit Outlook, February 10, 2026
3. Business Wire / Sinda Ltd. — Sinda to Begin Trading on NYSE, June 26, 2026
4. Mexico Business News — Sinda’s NYSE Debut Backed by Fresnillo, Franco‑Nevada, June 2026
5. S&P Global Market Intelligence — From Discovery to Delay: Mine Permitting Stretches Project Timelines, July 8, 2026 (updated); From 6 Years to 18 Years: The Increasing Trend of Mine Lead Times, April 11, 2025
6. Silver Institute / Metals Focus — Silver Supply & Demand (2025 data), April 2025
7. Investing News Network — Silver Institute: Sustained Supply Deficit Exposes Market to Squeezes, April 27, 2026
8. Discovery Alert — Top 20 Primary Silver Mines: Mexico Leads Global Production, September 17, 2025
Disclaimer: This article is informational only and does not constitute financial or investment advice. Consult a qualified financial adviser before making investment decisions.
You May Also Like:
- Gold Price Outlook July 2026: The Price Fell. Case Intact.
- Buying the Top: A Survival Guide for Gold and Silver Investors
- How Do Gold Price Cycles Work? A Framework Across Four Time Horizons
- The $300 Billion Lesson: What Frozen Reserves Taught Central Banks About Gold
- How To Perform Silver Technical Analysis (in 5 Steps)
- Who Controls the Gold Market? Meet the Five Banks That Settle Every Ounce
- How the Jobs Report Moves Gold and Silver: The Five‑Step Chain Behind Every Move
Popular Topics
Picked from the archive
-
01
 Topics
Why Silver Price Jumped Nearly 5% Today
-
02
Topics
Why Global Silver Demand Exceeds Mining Supply
-
03
Topics
How Profit Booking Works in Gold and Silver
-
04
Topics
Why Gold Soared 40% This Year After Moody’s Downgrade
-
05
Topics
Silver-to-Dow Ratio: Is Silver Moving from Paper to Physical?
-
06
Topics
Fed Decision Looms: Gold Poised for 8:30 AM Reaction
-
07
Topics
Gold Drops 9%: CPI Report Could Extend or Reverse the Slide
-
08
Topics
Gold Drops 1.2%, Silver 2.8% as Support Holds