War Sends Gold Prices to Worst Quarter Since 2013
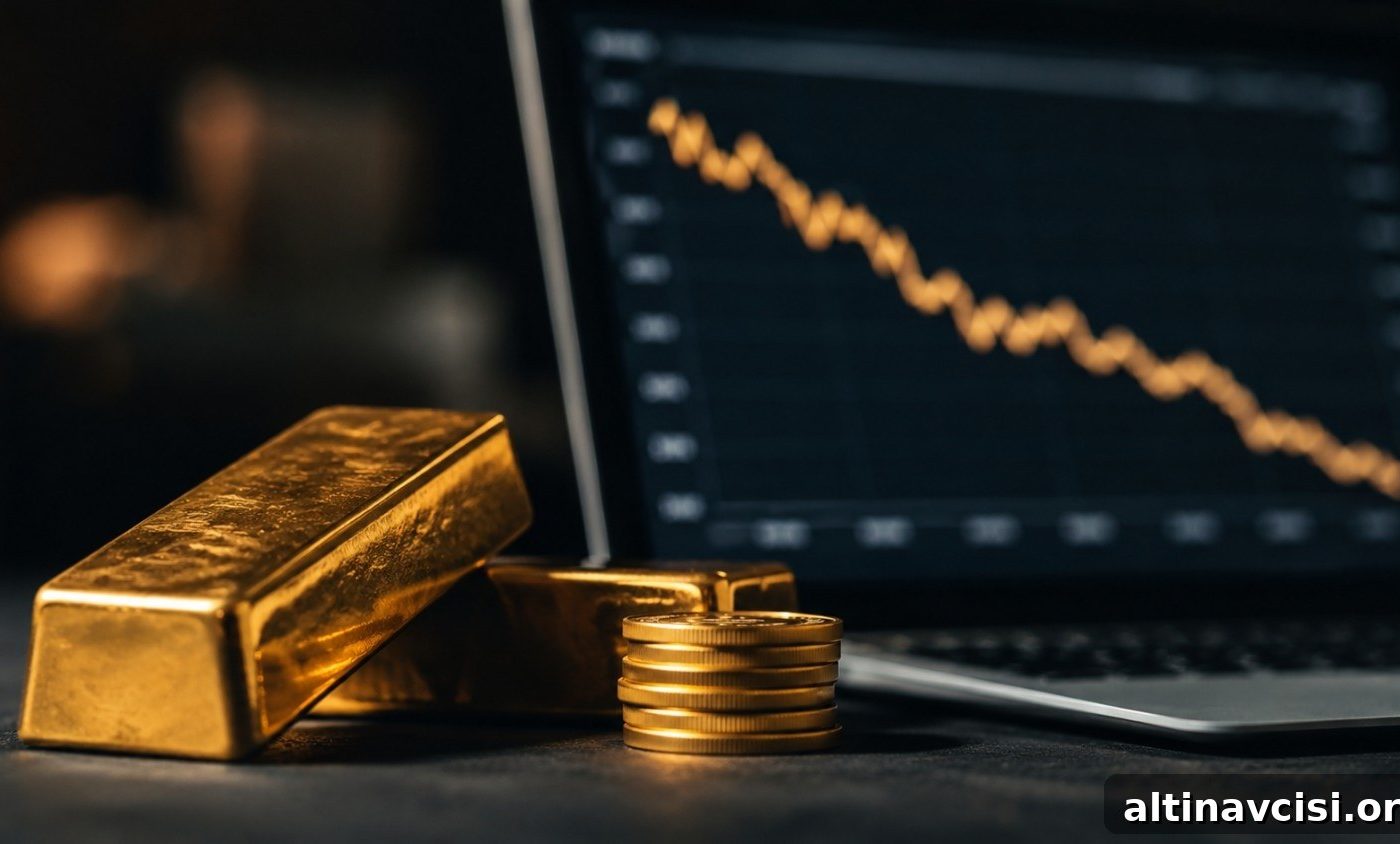
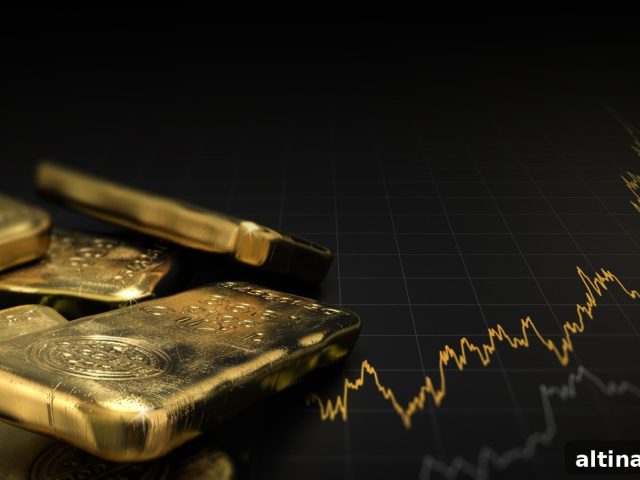
Gold began the second quarter near $4,700 per ounce and closed the quarter on June 30, 2026, around $4,015 — a roughly 14% decline that marks the metal’s weakest quarterly performance since Q2 2013. While headlines have focused on the immediate drivers, the full picture shows how macro forces and market structure combined to produce an unusual outcome: falling gold prices during active conflict in the Middle East.
The conventional explanation — higher expected interest rates, a stronger U.S. dollar and rising real yields — is accurate but incomplete. Those factors explain why financial traders sold bullion. What made this quarter unusual is that gold’s traditional safe-haven status did not override the market’s sensitivity to yields and opportunity cost.
Gold fell during a period of war, not despite it.
Historically, geopolitical tensions, especially in the Middle East, have supported gold by boosting safe-haven demand and elevating inflation expectations via higher oil prices. In this episode, the conflict and resulting Strait of Hormuz disruption did push oil and inflation expectations higher. That inflation pressure, however, produced a chain reaction: policymakers signaled a more hawkish stance to contain inflation, rate-hike odds rose, and real yields moved higher. Rising real yields increase the opportunity cost of holding non-yielding assets like gold, leading paper investors to reduce exposure even as physical demand remained robust.
Why Did a War Push Gold Lower Instead of Higher?
Gold does not generate income; its value is largely a function of monetary considerations and the cost of holding it relative to alternatives. Real interest rates — nominal rates adjusted for inflation — are a key variable. When real yields are low or negative, gold’s holding cost is relatively attractive and its price tends to rise. When real yields rise, that dynamic flips: the opportunity cost of owning non-yielding bullion increases and price pressure follows.
The recent sequence — conflict, higher oil prices, upward pressure on inflation, and a more hawkish Federal Reserve outlook — produced higher real yields. That sequence is mechanically negative for gold’s paper price even while it reflects no change to gold’s fundamental role as a store of value and monetary asset. In other words, this sell-off is a repricing driven by macro conditions rather than a reassessment of gold’s long-term function.
A useful precedent is the 2013 taper episode, when expectations of tighter U.S. policy pushed real yields higher and sent gold sharply lower. Those moves were painful in the short term but did not invalidate a longer-term bullish cycle that followed. Volatility and multi-year cycles are part of how gold markets adjust to shifts in policy, growth and inflation expectations.

The Edge Every Investor Needs
Smarter precious metals investing starts with clear market insights, timely Fed commentary and unbiased data on physical demand.
What Are Central Banks Doing While Paper Traders Sell?
While forward-looking paper traders have been reducing gold exposure in response to higher rate expectations, many sovereign and retail buyers have behaved differently: they continued to accumulate physical gold. Central bank buying and strong bar-and-coin demand highlight a persistent divergence between the paper market, which reacts quickly to interest-rate signals, and the physical market, which responds to long-term monetary and balance-sheet considerations.
Central banks around the world have reported ongoing net purchases, reflecting reserve diversification and strategic accumulation. Retail bar and coin demand in Asia and elsewhere has remained elevated, signaling continued physical interest even at lower prices. Institutional research that trimmed near-term price forecasts generally preserved a longer-term bullish thesis, emphasizing that short-term headwinds do not negate structural drivers for gold.
In short: the paper market is adjusting to a prospective rate environment; the physical market is positioning for a longer horizon. That divergence can produce sharp price moves that reverse once policy expectations change or real yields decline.
What Would Reverse Gold’s Q2 Decline?
Near-term economic data will determine whether this quarter’s repricing is sustained. Key releases, such as manufacturing activity and the monthly jobs report, test whether the economy is strong enough to justify the rate hikes that markets currently expect. If those data points soften, expectations for rate increases would fall, real yields could compress, and the mechanical forces that weighed on gold would begin to reverse.
That reversal would be driven by macro mechanics rather than sentiment alone. Physical holders typically do not try to time short-term reversals; they own bullion as protection against purchasing-power erosion across years and decades. A 14% quarterly decline in the paper price does not alter the long-term rationale for owning gold as part of a diversified portfolio focused on preserving real wealth.
This is not wishful thinking: it reflects how monetary assets behave under different interest-rate and inflation regimes. Investors who focus on the long-term role of gold weigh multi-year trends in monetary policy, central-bank balance sheets and global savings behavior rather than quarter-to-quarter price swings.
SOURCES
1. GoldSilver.com — Live gold and silver spot price charts (spot prices, June 30, 2026).
2. Reuters coverage summarized by major outlets — reporting on Q2 2026 gold performance and Fed expectations (June 30, 2026).
3. World Gold Council — Gold Demand Trends Q1 2026 (physical demand and central bank purchases).
4. OCBC Group Research — Precious metals commentary (June 30, 2026).
5. CME Group — FedWatch Tool (market-implied rate hike probabilities).
6. Goldman Sachs Global Investment Research — Precious metals outlook (June 2026).
7. JPMorgan Global Research — Gold price analysis and forecast (June 2026).
8. Macrotrends — Historical gold price data and quarterly declines.
Disclaimer: This article is for informational purposes only and does not constitute financial or investment advice. Consult a qualified financial adviser before making investment decisions.
You May Also Like:
- 172,000 Jobs Doubled the Forecast. Thursday’s Report Could Move Gold Again.
- The Dot Plot Has 18 Dots. The Chair Withheld His.
- Gold’s Worst Week of 2026. Central Banks Just Filed a Record Buy Signal.
- Silver Looks Like It’s Losing. The Ratio Says It’s Loading.
- Q1 GDP Beat. Jobless Claims Beat. Gold Rose. Here’s Why.
- PCE Hit 4.1%. Gold Went Up. Here’s Why.
- 298 Tonnes of ETF Gold Is Underwater. Central Banks Aren’t.
Popular Topics
Picked from the archive
-
01
 Topics
Could Gold Hit $5,000? Goldman Sachs Explains
-
02
Topics
Why Boring Gold Outperformed Nasdaq by 30% in 5 Years
-
03
Topics
Gold vs Savings Account: Which Investment Beats Inflation Now?
-
04
Topics
Gold Rebounds from Two-Week Low Ahead of Trump-Zelenskiy Summit
-
05
Topics
Gold Prices Rise for Seventh Week as Jobs Data Goes Dark
-
06
Topics
Gold Remonetization: 6 Forces Reviving Gold as Money
-
07
Topics
Gold vs Silver: Why Gold Stabilizes Markets, Silver Amplifies
-
08
Topics
Gold Breaks Through $4,400 as Silver Targets $70