Gold Price Down 25%: Morgan Stanley’s $5,200 Target
Key Takeaways
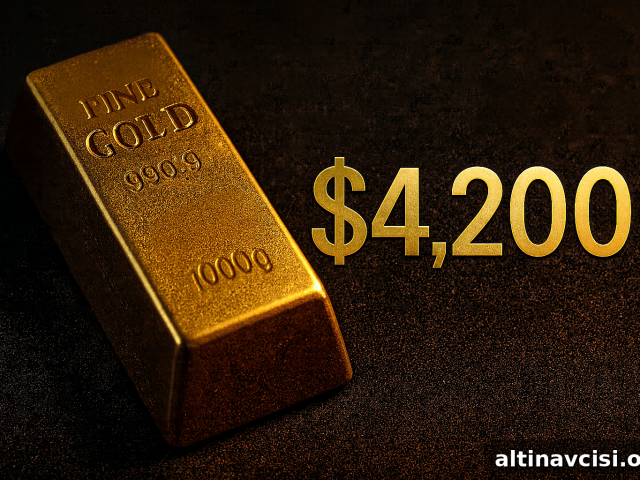
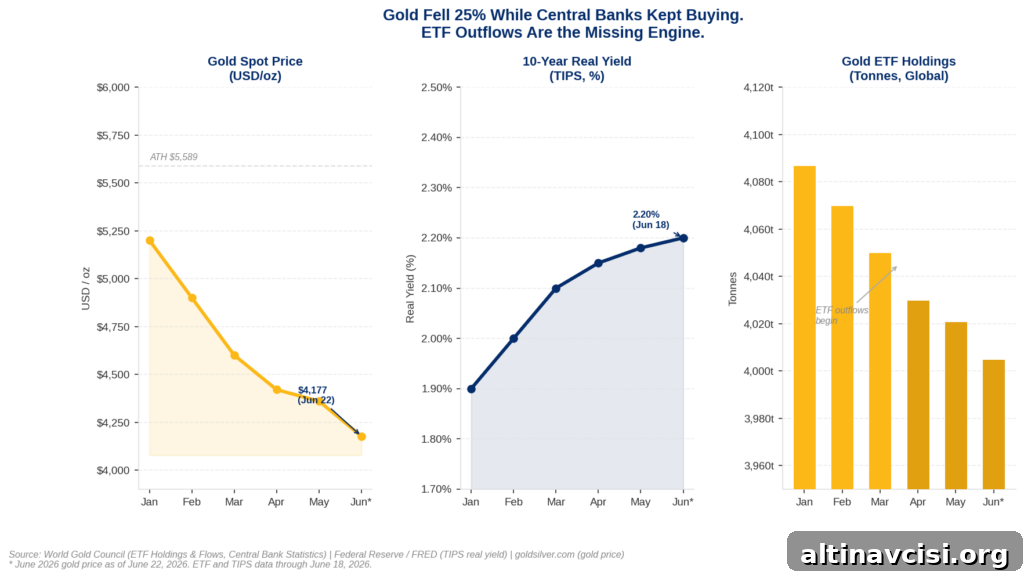
- Gold is trading near $4,177 an ounce today, roughly 25% below its January 2026 peak of $5,589, yet still about 28% higher year-over-year.
- Morgan Stanley retains an upside bias for gold in the second half of 2026 and argues a return of Western ETF buyers is necessary for gold to approach its $5,200 scenario.
- Bank of America’s June 2026 fund manager survey found 58% of 198 managers overseeing $540 billion expect stagflation; the proportion calling gold “overvalued” has declined from earlier in the year.
- The People’s Bank of China purchased nearly 10 tonnes of gold in May 2026, extending a buying streak to 19 months; global central banks bought an estimated 244 tonnes in Q1 2026 according to the World Gold Council.
- Historically, gold has not always fallen after Fed hikes; on average it rose modestly in the month after a 25 bps hike, and in some tightening episodes rate increases coincided with gold rallies driven by growth fears.
- Gold’s structural support is driven by long-term central bank accumulation and real-asset demand; short-term ETF flows are cyclical and sensitive to real yields and Fed guidance.
What Is Happening to the Gold Price Right Now?
After reaching an all-time high of $5,589 per ounce in January 2026, gold has pulled back to around $4,177. That roughly $1,400 drop has created two reactions among investors: concern from traders focused on short-term moves, and calm from long-term holders who view recent action through the lens of underlying demand drivers. The essential question is which of the market’s three core demand engines are active now and which are temporarily dormant.
Morgan Stanley’s commodities strategists recently argued that the structural case for gold remains intact heading into the second half of 2026. They say a path to $5,200 still exists — but it depends on the return of one specific buyer type: Western ETF investors, who are particularly sensitive to the Federal Reserve’s stance.
Understanding the demand chain and the timing of these forces is more useful than simply watching the headline price.
Which Three Forces Drive Gold — and Which Two Are Already There?
The gold market is driven by three distinct demand engines, each operating on different time horizons and responding to different signals:
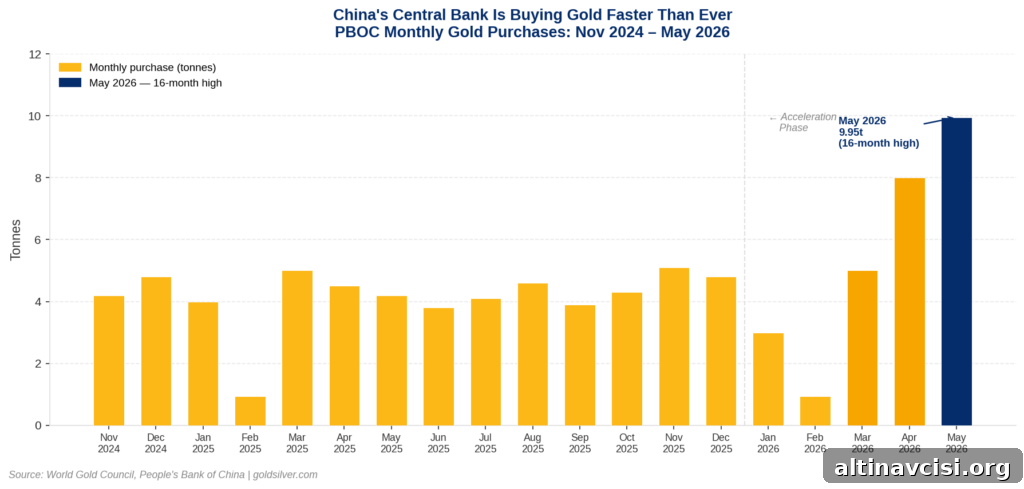
Engine one: official sector buying. Central banks, sovereign wealth funds, and reserve managers act on multi-decade horizons. They have been accumulating gold at an elevated pace: the People’s Bank of China reported roughly 9.95 tonnes purchased in May 2026, marking the 19th consecutive month of net buying since November 2024 and totaling an estimated 67 tonnes since then. The World Gold Council estimated global central-bank purchases at about 244 tonnes in Q1 2026, above recent averages. These are strategic reserve decisions, not short-term momentum trades.
Engine two: stagflation expectations. Bank of America’s June 2026 Global Fund Manager Survey (198 managers, $540 billion AUM) found 58% expect stagflation over the next 12 months — a combination of sluggish growth and persistent inflation. Stagflation is historically favorable for gold because it erodes real returns on cash and bonds, strengthening demand for a non-yielding real asset that preserves purchasing power.
Engine three: Western ETF demand. This group — Western institutional and retail investors allocating through ETFs — is the engine currently muted. ETF flows are short- to medium-term and highly responsive to opportunity cost measured by real yields and Treasury returns. Morgan Stanley highlights ETF demand as the missing piece needed to push prices back toward prior highs.
Why Have Gold ETFs Stopped Buying?
ETF flows have slowed because the opportunity cost of holding gold has risen. Real yields on 10-year TIPS are elevated (near 2.2% in mid-2026), and higher nominal yields have moved Treasury returns upward. After the June 2026 Federal Open Market Committee meeting, the Fed signaled that further tightening might be required; a number of Fed officials projected at least one rate hike before year-end. As markets priced in a higher-for-longer rates scenario, nominal and real yields rose, making non-yielding gold less attractive to quarterly-minded ETF investors. That led to net outflows from ETFs and contributed to the recent price decline.
The chain is clear: a hawkish Fed lifts real yields, raising the cost of holding gold in ETF structures, which prompts outflows and applies downward pressure on price. Importantly, the chain operates in both directions: lower real yields and softened rate expectations can re-ignite ETF buying.
The Knowledge That Changes Everything
Two concise guides, free: why gold remains relevant and how fiat currencies erode purchasing power over time.
What Changes the Math for Gold ETFs?
Morgan Stanley highlights two variables that could pivot ETF demand back into the market: energy prices and the Fed’s rate outlook. Higher oil earlier in the year forced some oil-importing central banks into difficult fiscal positions, at times prompting reserve sales to defend currencies. If Middle East tensions ease and oil drifts lower — Brent was trading below $80 in mid-2026 — that can relieve fiscal and inflationary pressure. Lower energy costs would push down headline inflation, reduce the odds of additional Fed hikes, lower real yields, and make gold comparatively more attractive for ETF investors. In short, softer energy prices can set off the sequence that restarts ETF demand.
Morgan Stanley’s $5,200 scenario is not an isolated price forecast; it’s a conditional thesis about the timing and sequencing of these macro variables and investor behavior.
Does a Hawkish Fed Automatically Mean Lower Gold Prices?
The simple rule that higher rates always hurt gold is incomplete. Historical analysis shows that gold has on average edged higher in the month following a 25 bps Fed hike. More telling are episodes — June 2006, December 2018, March 2023 — where rising rates coincided with growth worries or financial stress, and gold rallied as investors sought real assets. What matters is not the absolute level of rates but the broader economic context: if hikes induce growth concerns while inflation remains elevated, gold can benefit even in a rising-rate environment.
What Does This Mean for the Individual Gold Investor?
For long-term investors and holders of physical bullion, the current correction is layered: a durable structural floor created by central-bank accumulation and a growing expectation of stagflation, combined with a cyclical pullback driven by ETF outflows. Central banks and long-horizon investors do not change course after a single Fed meeting. Conversely, ETF flows are cyclical and sensitive to changes in real yields and the Fed’s communicated path. That makes the ETF engine the likeliest to flip back when inflation readings — possibly helped by lower energy prices — reduce the probability of further hikes.
For investors focused on preserving purchasing power over decades, the actions of official buyers and the macro backdrop supporting real-asset demand are the more important signals than short-term ETF movement. For those trading ETFs for quarterly performance, real yields and Fed guidance will likely remain the dominant influence.
Stay On Top of Gold & Silver Prices
Get important market alerts sent to your inbox.
People Also Ask
Why is gold falling when inflation is still high?
Short-term gold prices are being pressured by rising real yields, which increase the opportunity cost of holding a non-yielding asset. The Federal Reserve’s hawkish guidance in mid-2026 pushed real and nominal yields higher, prompting Western ETF investors to reduce allocations. That cyclical dynamic exists alongside a structural story of central-bank accumulation and growing institutional recognition of stagflation risk.
What does Morgan Stanley’s $5,200 gold price target depend on?
Morgan Stanley’s target depends on the return of ETF buying. That requires a shift in the Fed outlook — or other evidence that further rate hikes are less likely — which would lower real yields and reduce the opportunity cost of holding gold. One plausible trigger is a fall in energy prices that translates into lower inflation readings and eases the Fed’s tightening bias.
Is 58% of institutional managers expecting stagflation significant for gold?
Yes. Stagflation — low growth combined with persistent inflation — historically favors gold because it undermines both growth-sensitive assets and the real returns of cash and bonds. The Bank of America survey result is an important gauge of institutional sentiment supporting demand for real assets like gold.
Why has the People’s Bank of China been buying gold for 19 consecutive months?
China’s purchases reflect strategic reserve diversification. Central banks value gold for safety (no counterparty risk), liquidity, and diversification away from dollar assets. The PBOC’s steady accumulation through price fluctuations indicates a long-term policy choice rather than short-term speculation.
Does a hawkish Fed automatically mean lower gold prices?
Not automatically. While higher rates can increase the opportunity cost of holding gold, episodes exist where rate hikes have coincided with gold rallies because they sparked growth concerns or financial stress. The interplay of inflation, growth prospects, and policy credibility determines gold’s path as much as headline rate levels.
What is the difference between gold ETFs and physical gold for long-term investors?
Gold ETFs deliver price exposure without direct legal ownership of specific bars, whereas allocated physical gold grants direct ownership and avoids counterparty risk. ETF flows can be volatile and driven by short-term portfolio considerations; physical holdings reflect a long-term hedge against currency depreciation and preserve exposure independent of quarterly fund flows.
SOURCES
1. Investing.com via Yahoo Finance — Gold faces hurdle on path to $5,200 as hawkish Fed dampens ETF demand, MS says
2. Crypto Briefing — Bank of America survey shows gold least overvalued in 2.5 years as stagflation fears dominate
3. TradingView / MaceNews — BofA Global Research Fund Manager Survey, June 5–11 2026
4. Bloomberg — China’s Central Bank Extends Gold-Buying Streak in May
5. World Gold Council — Central Bank Gold Statistics: Central Banks Resume Net Buying in April
6. World Gold Council — China Gold Market Update: A Notable Rise in Gold Reserves
7. Federal Reserve Bank of St. Louis / FRED — 10-Year TIPS Real Yield (DFII10)
8. Morgan Stanley Research — Gold’s Safe-Haven Status Faces a Reality Check
9. World Gold Council — Gold Demand Trends Q1 2026: Central Banks
Disclaimer: This article is for informational purposes only and does not constitute financial or investment advice. Consult a qualified financial adviser before making investment decisions.
You may also like:
- Solar Cut 19% Silver. The Deficit Widened Anyway.
- Gold Down 26%. Barclays’ $4,791 Target Never Moved.
- Gold Silver Ratio at 64: What It Signals for Silver in 2026
- How Central Banks Decide How Much Gold to Hold
- How Much Does Gold Storage Cost? The $72-a-Year Answer
- Silver Price Outlook June 2026: The Correction Was the Setup
- Wall Street’s $6,000 gold call rests on data most investors never see
- Silver Eagle vs. Maple Leaf vs. Britannia: Which Gives You More Silver?
Popular Topics
Picked from the archive
-
01
 Topics
401(k) Rollover to a Gold IRA: Step-by-Step Guide
-
02
Topics
Gold Price Hits $4,200: What This Means for Investors
-
03
Topics
France Completes Gold Repatriation, Germany Set to Follow
-
04
Topics
How to Sell Gold and Silver Safely and Avoid Scams
-
05
Topics
Silver Price Nears $50: Will It Break Its All-Time High?
-
06
Topics
Gold vs. Stocks 2026: Q1 Returns Investors Need to Know
-
07
Topics
Silver Squeeze Pushes Silver Prices Above $51
-
08
Topics
Moody’s: 50% of U.S. Industries Cutting Jobs Amid Recession Risk