Silver Drops 22% in 30 Days as Gold to Silver Ratio Hits 63
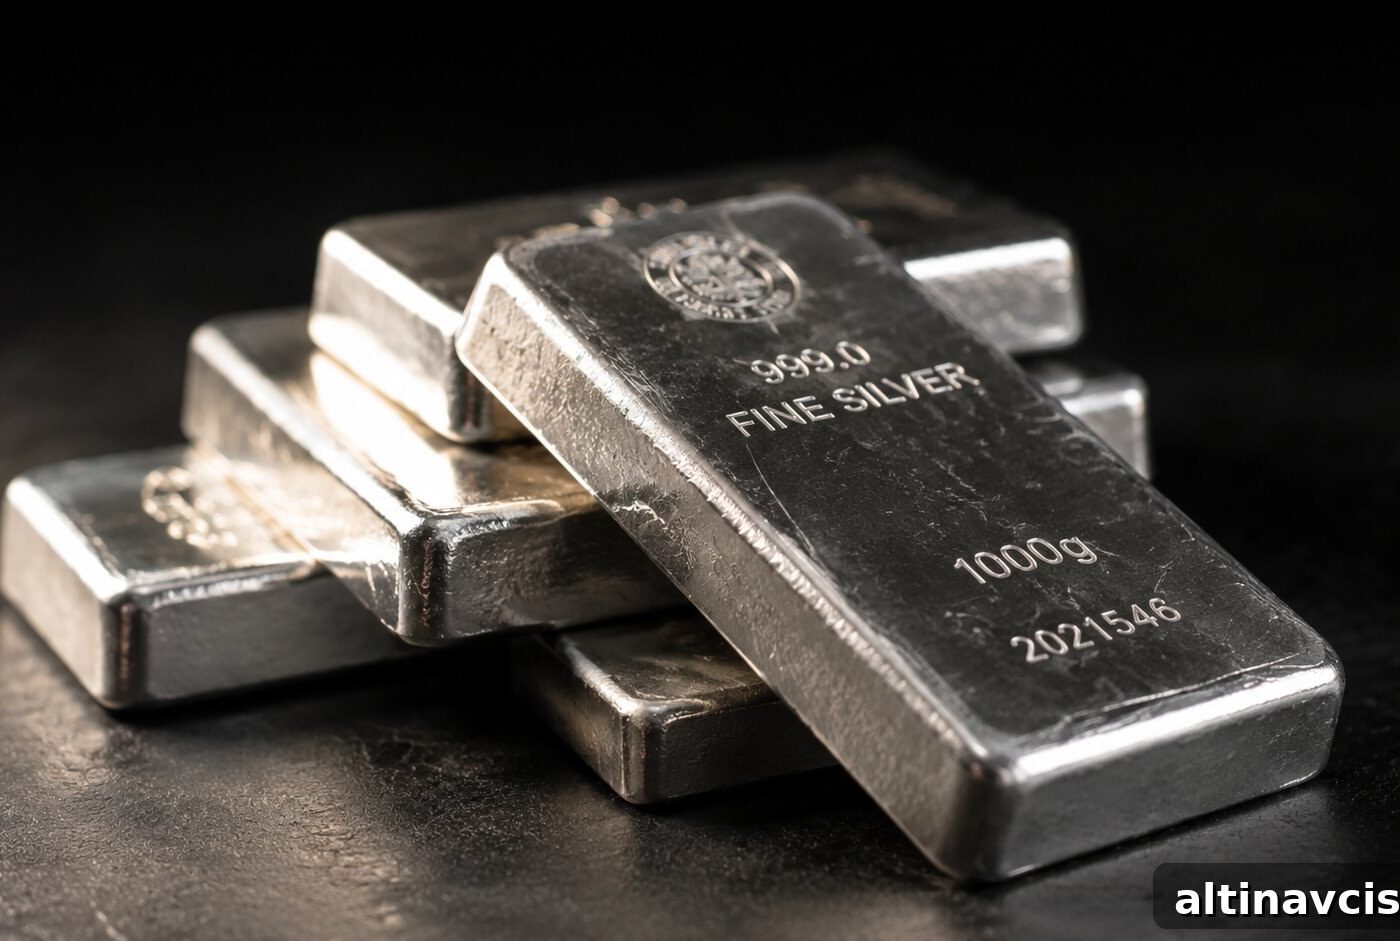
Over the past 30 days, gold has declined by roughly 10%, while silver has fallen by more than twice that amount.
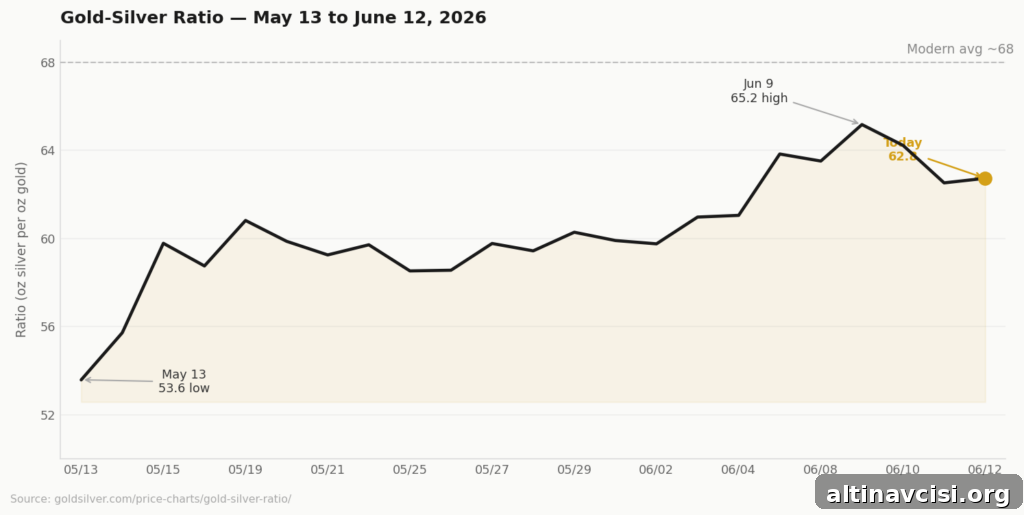
As of Friday morning, the gold-silver ratio sits near 63 — meaning it now takes more than 63 ounces of silver to buy one ounce of gold. A month ago the ratio was about 55. An 8-point swing in 30 days is not random noise: it reflects a clear market mechanism and a history of predictive outcomes when that mechanism resolves.
Why does silver move differently than gold?
Gold is primarily a monetary metal: its price is driven mainly by real yields, the strength of the dollar, and confidence in fiat currencies. Silver is influenced by those same monetary factors, but it also has a significant industrial role. Silver is used in solar panels, electric vehicles, electronics, and data centers. That industrial demand consumes roughly 660 million ounces of silver each year (Silver Institute, World Silver Survey 2026).
When monetary fear rises — for example, when markets expect higher interest rates, face inflation shocks, or see central bank uncertainty — investors typically move capital into gold first. Gold is the classic flight-to-safety asset. Silver often follows as a monetary metal, but because it also serves industry, it is more sensitive to growth slowdowns and rising production costs.
At present, both of silver’s demand drivers are facing headwinds simultaneously.
The monetary engine has cooled. The conflict that began in late February pushed energy prices higher, which flowed into consumer and producer inflation measures. May’s producer price index printed at 6.5% year-over-year — the highest since November 2022, according to the Bureau of Labor Statistics — and markets reacted by pricing in a greater chance of tighter policy. Higher expected rates weigh on both gold and silver, but gold’s purely monetary character gives it a firmer floor. Silver, exposed to industrial demand pressures as well, has declined more steeply.
Higher energy and commodity prices have also prompted some solar manufacturers to reduce the silver content in panels, trimming demand at the margin. The combination of a weaker monetary bid and a softer industrial demand story widened the gold-silver ratio — that is the mechanism behind the recent move.
The Edge Every Investor Needs
Smarter precious metals investing starts here. The Nuggets Newsletter brings market insights, Fed updates, global trends, and educational resources for serious investors.
What does a gold-silver ratio above 60 historically signal?
The gold-silver ratio must be read in context. The 60–75 range lies near the modern historical average and is not an extreme by itself. During the March 2020 market panic the ratio spiked to 125 when silver crashed while gold held firm. In early 2024 it reached 88 — and that preceded a major silver rally into 2025 when silver climbed roughly 144%.
Both the level and the pace of change matter. A move of more than eight points in 30 days signals that the monetary bid is suppressed, not broken. Underneath that ratio, the physical market remains tight. The Silver Institute’s World Silver Survey 2026 (with Metals Focus) projects a supply deficit of about 46.3 million ounces for the year — the sixth consecutive annual shortfall since 2021.
For holders of physical silver, this is a notable combination: the ratio is signaling relative cheapness, while supply data points to scarcity. Historically, those two signals appearing together have often presaged strong returns when the monetary bid returns.
When the monetary suppressor lifts, the price response can be rapid, and the physical market’s multi-year deficit tends to amplify moves higher for silver.
What could push the gold-silver ratio lower from here?
Two events in the next few days could meaningfully affect the ratio.
First, reports indicate a potential U.S.–Iran memorandum of understanding that would reopen the Strait of Hormuz in exchange for sanctions relief. If such an agreement is finalized and implemented, oil prices would likely fall, easing energy-driven inflation. Lower energy inflation would reduce the probability of tighter monetary policy and allow the monetary bid for precious metals to recover — helping silver’s monetary component re-engage.
Second, the Federal Reserve meeting on June 16–17 will include the first Summary of Economic Projections under new leadership. Markets largely expect the Fed to hold the policy rate at the current 3.50–3.75% range, but the dot plot and median projections can shift expectations on future hikes. If the Fed’s projections look less hawkish than feared, the monetary suppressor loosens for both metals — and silver tends to rally faster relative to gold.
Neither outcome is certain: the Iran memorandum would still require final sign-off, and the Fed’s projections could prove hawkish. But the prevailing setup is clear: the ratio widened because of monetary fear. If that fear recedes, the ratio should compress, and silver historically compresses faster than gold expands.
Why does the structural silver supply deficit matter for price?
The gold-silver ratio does not reflect the structural supply deficit directly. Since 2021 mine supply has fallen short of total demand every year. The Silver Institute projects the deficit will widen to about 46.3 million ounces in 2026. Physical coins, bars, and exchange-traded products are soaking up a growing share of available metal, and those flows are not fully offset by reductions in industrial silver intensity.
A high ratio can persist for extended stretches — it sat above 80 for more than a year around 2019–2020 — so mean reversion should not be assumed as guaranteed or immediate. Still, a widening structural deficit combined with a monetary bid that is paused rather than permanently broken creates a constructive backdrop for long-term physical silver holders.
At a ratio near 63, after a 30-day correction driven largely by identifiable monetary pressures, silver is cheaper relative to gold than it was a month ago while the physical market remains tight. That is arithmetic, not alarm.
Stay On Top of Gold & Silver Prices
Get timely market alerts delivered to your inbox.
SOURCES
1. LBMA — Precious Metal Prices & Historical Data
2. Silver Institute / Metals Focus — World Silver Survey 2026
3. Bureau of Labor Statistics — Producer Price Index, May 2026
4. Bloomberg — Reporting on U.S. and Iran negotiations around the G7 meeting (June 2026)
5. CME Group — FedWatch Tool, June 2026
6. Chase / J.P. Morgan Wealth Management — Coverage of the Fed meeting and leadership change
7. Brown Brothers Harriman — Fed commentary
8. Market coverage and reporting on May PPI and related inflation moves
9. Trading and historical price data for silver and gold
Disclaimer: This article is for informational purposes only and does not constitute financial or investment advice. Always consult a qualified financial adviser before making investment decisions.
You May Also Like:
- Every Bearish Catalyst Landed at Once. Gold and Silver Went Up Anyway.
- Gold at Seven-Month Lows: Why Geopolitical Fear Is Not Enough
- Gold Slides to $4,130 as Iran War Turns Inflation Against It
- May CPI Printed 4.2%. Core Inflation Beat. So Why Did the Gold Price Drop?
- Gold Is Down 9%. The CPI Print That Could Either Extend the Drop — or End It.
- Gold Price News: Goldman, China, CPI, and the Fed Explained
- Gold Near $4,330 as Rate-Hike Bets Hit 70% and China Acts
- Gold Is Down 22% — The Same Drop as 2022. The Floor Is Not the Same.
- Silver Falls 6% on Jobs Beat. The Six-Year Deficit Didn’t.
Popular Topics
Picked from the archive
-
01
 Topics
Gold Hits $4,000: Why the Debasement Trade Isn’t Dead
-
02
Topics
Elon Musk Sparks Silver Demand Boom for Green Tech
-
03
Topics
Silver Prices Eye Record Highs as Fed Signals Rate Cuts
-
04
Topics
Gold Price Nears $4,000 as U.S. Data Confidence Falters
-
05
Topics
Gold Prices: 5 Forces Investors Are Watching Now
-
06
Topics
How Kevin Warsh as Fed Chair Could Affect Gold Prices
-
07
Topics
Updated 2026 Gold Price Outlook After Q1
-
08
Topics
Why Gold Prices Are Falling Despite Global Turmoil