Gold Price Drops to $4,130 as Iran Conflict Fuels Inflation

Key Takeaways
- Gold dropped to $4,130 per ounce today — the weakest level since late November 2025 — following hotter-than-expected CPI data and renewed U.S.-Iran military strikes.
- The May Consumer Price Index (CPI) rose 4.2% year-over-year, the strongest annual reading since April 2023; energy accounted for more than 60% of the monthly increase.
- Paradoxically, this Iran conflict is short-term bearish for gold: the oil shock pushes inflation higher, which raises expectations for Fed rate hikes and increases the opportunity cost of holding non-yielding gold.
- Core CPI, which excludes food and energy, printed +0.2% month-over-month and 2.9% year-over-year — a sign that underlying inflation outside energy remains contained for now.
- If and when the Strait of Hormuz reopens and energy prices ease, the sequence reverses: oil falls, headline CPI cools, rate-hike expectations retreat, and gold typically recovers.
A social post from former President Trump this morning — calling Iran’s military “a complete and total mess” — will be treated by many as political noise. But it helps explain the market’s tempo: statements and military actions around the Strait of Hormuz influence traders’ risk assessments and, crucially, oil flows.
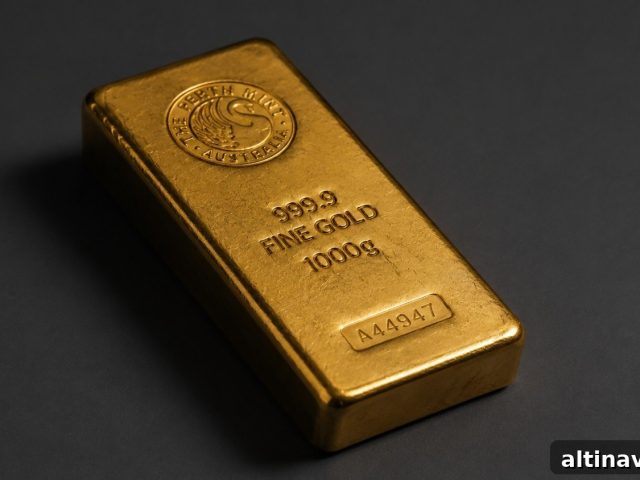
Gold is trading near $4,130 per ounce, down about $130 or roughly 3% on the day — the lowest level since late November 2025. At first glance that decline looks counterintuitive: a rising geopolitical risk premium usually supports gold. The difference this time is that the conflict is interrupting global oil supply, which feeds directly into inflation and, in turn, into central-bank policy expectations.
The Edge Every Investor Needs
Smarter precious metals investing starts here. The Nuggets Newsletter brings essential market insights, Fed updates, global trends, educational videos, and much more.
Why Is Gold Falling During a War?
The conventional rule-of-thumb — geopolitical risk lifts gold — still holds. But this conflict is a different kind of shock because it disrupts a large share of global oil trade. The economic effect of that disruption can dominate the safe-haven impulse, at least in the short run.
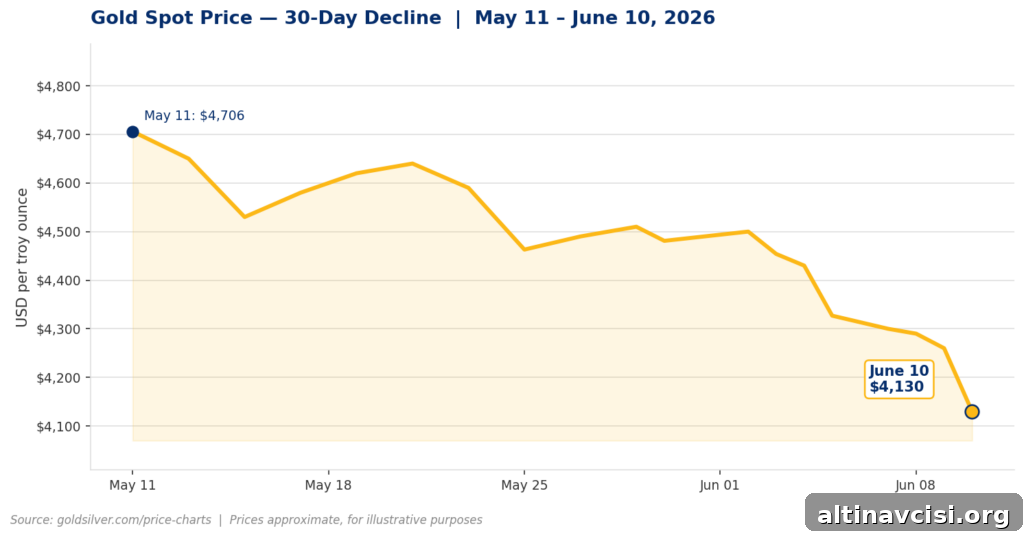
Here is the practical, four-link chain that explains today’s move:
1) The Strait of Hormuz has been effectively closed. Since the US-Iran military escalation began on February 28, 2026, the Strait — which handles roughly one in five barrels traded globally — has been constrained. That loss of transport capacity pushes energy prices higher.
2) Energy is the main driver of the recent CPI jump. The U.S. Bureau of Labor Statistics reported May CPI at +4.2% year-over-year, the strongest since April 2023. Energy contributed more than 60% of the monthly gain; gasoline rose sharply.
3) Higher energy-driven inflation increases the odds of Fed rate hikes. When inflation accelerates, markets and policymakers reassess the path for interest rates. Current pricing reflects a materially higher probability that the Federal Reserve will tighten policy relative to prior expectations.
4) Rising rate expectations raise the opportunity cost of holding gold. Gold does not pay interest. When real yields (nominal rates minus inflation) rise or when the market anticipates higher nominal rates, investors often reduce gold allocations in favor of yield-bearing assets. That rotation explains much of today’s selling pressure.
Recent military exchanges — U.S. strikes on Iranian air-defense targets near the Strait, followed by Iranian claims of retaliation — have hardened the view that the waterway will remain constrained until diplomatic or military pressure eases. As long as that constraint persists, the inflation argument for higher rates stays active, and gold is likely to face pressure.
Does Core CPI Tell a Different Story?
Yes. Headline CPI moved the market, but core CPI is the better measure of whether price pressure is spreading into wages, rents, and services. Core CPI rose 0.2% month-over-month and 2.9% year-over-year, indicating that, so far, the inflation impact remains concentrated in energy rather than broad-based.
That matters for investors with a longer horizon. Energy-driven inflation is often temporary and linked to the specific disruption; core inflation drifting higher would signal a more persistent problem that could keep gold under longer-term upward pressure. For now, the data suggest the shock is concentrated.
What Happens to Gold When Hormuz Reopens?
If shipping through the Strait of Hormuz resumes and oil supply normalizes, the chain reverses: oil prices fall, headline CPI cools quickly, markets unwind rate-hike bets, real yields compress, and gold typically re-rates higher. That reaction highlights the difference between a policy-driven drawdown and a structural loss in gold’s case.
Despite the recent pullback — gold is down roughly 26% from its January 28, 2026, all-time high of $5,589.38 — structural drivers for gold remain: central-bank purchases have continued (China reported net buying through April 2026), U.S. national debt exceeds $36 trillion, and fiscal deficits are elevated. Those longer-term forces do not vanish with one CPI print.
Market participants will watch the Federal Open Market Committee meeting on June 16–17 closely; the dot plot and commentary will clarify how persistent officials expect inflationary pressures to be and how that will affect rate expectations and the gold market.
Stay On Top of Gold & Silver Prices
Get important market alerts sent straight to your inbox.
SOURCES
1. Gold price charts and history (industry price sources).
2. U.S. Bureau of Labor Statistics — Consumer Price Index, May 2026 (CPI release).
3. CME Group — FedWatch Tool (market-implied rate probabilities).
4. U.S. Central Command and major outlets — reporting on U.S.-Iran strikes and regional developments.
5. Bloomberg reporting on bank rate expectations and Fed policy outlook.
6. World Gold Council — central-bank gold activity and official purchases.
7. International Energy Agency — notes on the strategic importance of the Strait of Hormuz.
Disclaimer: This article is for informational purposes only and does not constitute financial or investment advice. Always consult a qualified financial adviser before making investment decisions.
You May Also Like:
- May CPI Printed 4.2%. Core Inflation Beat. So Why Did the Gold Price Drop?
- Gold Is Down 9%. The CPI Print That Could Either Extend the Drop — or End It.
- Gold Price News: Goldman, China, CPI, and the Fed Explained.
- Gold Near $4,330 as Rate-Hike Bets Hit 70% and China Acts.
- Gold Is Down 22% — The Same Drop as 2022. The Floor Is Not the Same.
- Silver Falls 6% on Jobs Beat. The Six-Year Deficit Didn’t.
- Gold Rate Hike Fears Are Weighing on Prices. Here’s the Full Picture.
- Gold at $4,480: Physical Demand Hits a 50-Year Milestone.
Popular Topics
Picked from the archive
-
01
 Topics
Trump $2,000 Stimulus Checks, Auto Loan Crisis and Silver Rally
-
02
Topics
Silver Rises 3% to $88 as Markets Shrug Off Risk
-
03
Topics
Warsh Inflation Measure: What It Means for Gold Prices
-
04
Topics
After January Jobs Surprise, Silver Dips as Gold Holds Firm
-
05
Topics
IMF: Treasuries Are No Longer Safe, Gold Reacted First
-
06
Topics
AI Bubble Fears Surge as Gold Price Falls Below 4,000 USD
-
07
Topics
How to Check If Your Gold Storage Is Allocated
-
08
Topics
How Stagflation Sparks Both Drivers of Silver