Bank of America’s $6,000 Gold Forecast Signals a Systemic Shift

Key Takeaways
- Bank of America’s $6,000 gold target is based on three structural forces: a deteriorating U.S. fiscal position (national debt above $39 trillion and net interest payments approaching or exceeding $1 trillion), a sustained wave of central-bank reserve diversification at more than 1,000 tonnes per year, and a private investor base that allocates only about 0.5% of assets to gold.
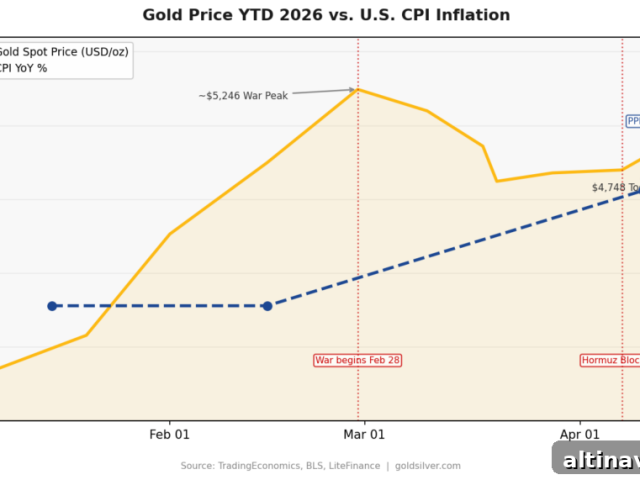
- Gold has risen dramatically since January 2025 — from $2,624 to $4,543 as of May 20, 2026, a 73% gain. The $6,000 forecast implies roughly another 32% upside from current levels; the market has previously traded above $5,000, confirming higher-price regimes are possible.
- The broader implication is systemic: when multiple major institutions independently converge on a $6,000 target, they are signaling that the macro conditions needed to stop gold’s advance — sustained fiscal consolidation, normalized real yields and renewed dollar strength — are unlikely to materialize in the near term. That’s a statement about monetary and fiscal dynamics as much as it is a metals forecast.

Your Gold Buying Guide Many investors pay too much when buying gold, and again when they sell. This guide explains what to own and why, with practical steps for entry and exit.
What Is Bank of America’s $6,000 Gold Target?
Bank of America’s metals research team, led by Michael Widmer, published a $6,000-per-ounce target for 2026. Unlike many cautious forecasts, BofA articulated a clear structural thesis rather than a hedged range or a conditional bullish scenario. Their view is driven by fiscal dynamics, central-bank behavior and the still-small allocation to gold among private investors — the same forces that pushed gold from roughly $2,624 in January 2025 to $4,543 by May 20, 2026.
Other major banks have similarly raised targets: JPMorgan, UBS and Goldman Sachs updated their 2026 views higher, signaling broad institutional conviction rather than isolated calls. The market question has shifted from whether gold will reach $5,000 — a level already breached in January 2026 — to what might stop it before it reaches the $6,000 zone.
What Are the Three Drivers Behind BofA’s $6,000 Target?
1. Is the U.S. Fiscal Problem Structural?
Yes. U.S. federal debt has risen above $39 trillion, and net interest payments have climbed sharply, exceeding many major budget items and projected to cross $1 trillion. That fiscal pressure forces a choice: sustained rapid growth, sustained inflation, or prolonged fiscal stress. Fast growth at current debt ratios is difficult; inflation that erodes real debt burdens is more plausible and is precisely the environment that benefits gold.
BofA argues this fiscal math implies continued monetary accommodation or at least suppressed real yields. When real yields are structurally low, the opportunity cost of holding non-yielding assets like gold declines, historically supporting higher gold prices.
2. Why Are Central Banks Still Buying Gold?
Central-bank behavior changed meaningfully after 2022, when sanctioning and asset freezes illustrated the risk of holding large foreign-currency reserves in jurisdictions that could restrict access. That episode prompted central banks to rebalance reserves toward less-credit-exposed assets. Official-sector gold purchases have exceeded 1,000 tonnes per year since 2022, more than double the prior long-term average. Major buyers include China and numerous central banks across Asia, the Middle East, Latin America and Europe.
This strategic reserve restructuring is a decades-long process. Even if some institutional investors reduce ETF allocations, central-bank demand tends to absorb supply, providing a persistent structural bid that was absent in earlier cycles.
3. Who Hasn’t Bought Gold Yet?
Most private investors. Bank of America’s research indicates that high-net-worth individuals globally hold only about 0.5% of assets in gold — a very low allocation compared with many portfolio models. Much of the recent rally has been driven by central banks and institutions; broad retail and private-investor participation, which often comes later in a bull market, has not yet fully arrived. When that cohort increases allocations, price momentum can accelerate.
A structurally weaker dollar also supports the diversification case: as the dollar’s share of global reserves has declined over recent decades, demand for alternatives like gold has risen. That dynamic strengthens the long-term bid for precious metals without requiring dramatic, sudden shocks.
Can Gold Really Reach $6,000 From Here?
Gold at $4,543 needs about a 32% rise to reach $6,000. That appears achievable given the 73% gain already realized since January 2025 and the persistence of the structural drivers: fiscal pressure, central-bank buying and gradual dollar diversification. Gold’s all-time high near $5,589 in January 2026 shows the market can trade in double-digit thousands per ounce territory.
The primary bear case would require several favorable developments to converge: a successful Fed soft landing with inflation returning to 2% without recession, credible and sustained U.S. fiscal consolidation, and a meaningful decline in geopolitical tensions that reduces the urgency for reserve diversification — all within a short time frame. While possible, those conditions would need to align quickly and decisively for gold’s advance to stall permanently.
What Does a $6,000 Target Say About the System?
A $6,000 price target is not only a commodity forecast; it is a view on macroeconomic and monetary regimes. When major financial institutions independently raise targets, they are implicitly stating that the counterfactual conditions — durable fiscal consolidation, normalized real yields and a resurgent dollar — are unlikely to be the near-term baseline.
If gold reaches $6,000 and sustains that level, it would transition from a niche allocation to a widely accepted institutional reserve asset with a multi-year track record. That narrative shift tends to attract more private and institutional buyers, which can extend price trends beyond what short-term models predict.
Stay On Top of Gold & Silver Prices
Receive market alerts and concise updates directly to your inbox.
People Also Ask
What is Bank of America’s gold price target for 2026?
Bank of America has a 12-month target of $6,000 per ounce for 2026, based on fiscal deterioration, sustained central-bank purchases and low private-investor allocations to gold.
Why are central banks buying so much gold right now?
Central banks increased purchases after 2022 when asset freezes highlighted the vulnerability of foreign-denominated reserves. That prompted reserve diversification toward assets that cannot be frozen or easily confiscated — and gold fits that role. Official-sector purchases have been materially higher since 2022 compared with prior years.
Is gold in a bubble at current prices?
According to the research cited by BofA, private allocations to gold remain low, suggesting retail and high-net-worth participation has room to grow. Because much of the rally so far has been driven by central banks and institutional flows, the market has not yet shown the classic retail-driven exhaustion that typically marks a bubble top.
How does U.S. national debt affect the gold price?
Rising debt and growing interest costs make fiscal management harder. If real yields remain suppressed because of monetary accommodation or inflation, gold’s opportunity cost declines and its appeal increases. These fiscal pressures are a key component of the case for higher gold prices.
What would stop gold from reaching $6,000?
To prevent gold from reaching $6,000, several things would need to occur together: a successful Fed soft landing (inflation back to 2% with no recession), credible fiscal consolidation in the U.S., and a material easing of geopolitical tensions that reduces reserve-diversification incentives. Major banks assess that the odds of all three happening within a year are low.
What This Means for Long-Term Holders
BofA’s $6,000 target is not a short-term buy trigger but a confirmation of a broader structural narrative. Physical gold’s appeal rests on being outside the financial liability system, resistant to capital controls and able to preserve purchasing power when real yields are pressured by fiscal and monetary dynamics. If those structural conditions persist, gold’s role as a portfolio diversifier and reserve asset becomes more compelling.
The forces that made gold at $2,624 look undervalued in January 2025 remain in place at current prices. While no forecast is guaranteed, a range of major institutions now read the macro backdrop as supportive of significantly higher gold prices over the coming year.
SOURCES
1. TheStreet — Bank of America Revamps Gold Price Target for 2026
2. Reuters — JPMorgan Sees Year-End 2026 Gold Price at $6,300 Per Ounce
3. Reuters / Yahoo Finance — UBS Raises Gold Price Target for 2026
4. TheStreet — Goldman Sachs Revamps Gold Price Target for the Rest of 2026
5. CNBC — Gold Climbs to a Fresh All-Time High in January 2026
6. CBS News — What Is the Highest Gold Price in History?
7. U.S. Congress Joint Economic Committee — Monthly Debt Update, May 2026
8. Congressional Budget Office — The Budget and Economic Outlook: 2026 to 2036
9. Bipartisan Policy Center — The Fiscal Outlook in CBO’s Latest 10-Year Baseline
10. World Gold Council — Gold Demand Trends
11. IMF — Currency Composition of Official Foreign Exchange Reserves (COFER)
Disclaimer: This article is for informational and educational purposes only and does not constitute investment advice. Consult a qualified financial adviser before making any investment decisions.
You may also like:
- Silver IRA Complete Guide: Rules, Limits, and Custodians Explained
- Silver’s Tesla Moment: The Solid-State Battery Thesis
- Physical Gold vs. Digital Gold: Which Is the Ultimate Safe Haven?
- BRICS Is Hoarding Gold. Here’s What It Means for Your Portfolio.
- Gold to Oil Ratio: The Ultimate Guide for Economic & Portfolio Analysis
- Dollar-Cost Averaging Into Gold and Silver: The Investor’s Practical Guide
- The Silver-to-Dow Ratio: How to Spot the Shift from Paper to Physical
- What Moves Gold Prices? Six Key Factors Explained
Popular Topics
Picked from the archive
-
01
 Topics
Stagflation and Gold: What the Selloff Means for Investors
-
02
Topics
US Tariffs on Swiss Gold Bars Disrupt Global Supply
-
03
Topics
Why Gold Holds Value: The 5,000-Year Truth Investors Miss
-
04
Topics
Gold Price Tops $5,500 Amid Accelerating Metals Rally
-
05
Topics
Fed Chair to Announce Policy Overhaul Amid Trump Pressure
-
06
Topics
Gold Price Down 10% From War Peak but Up 46% This Year
-
07
Topics
Q2 2025 Gold Demand Trends from the World Gold Council
-
08
Topics
Gold Price Nears $3,700 Ahead of Fed Meeting