How $1 Trillion in Debt Interest Is Driving Gold Prices

The United States now spends more on interest for its national debt than it does on defending the country. That shift happened quietly and many people missed it — but markets, and particularly gold, noticed.
On Friday, April 17, 2026, gold closed at $4,867 per ounce, rising 1.65% on the day, up more than 41% from a year earlier and marking a fourth consecutive weekly gain. Silver finished at $79.60, up 1.52% on the day and roughly 4% for the week, also posting its fourth straight weekly advance. The US Dollar Index, which measures the dollar against a basket of major currencies, remained near six-week lows in the upper 90s.
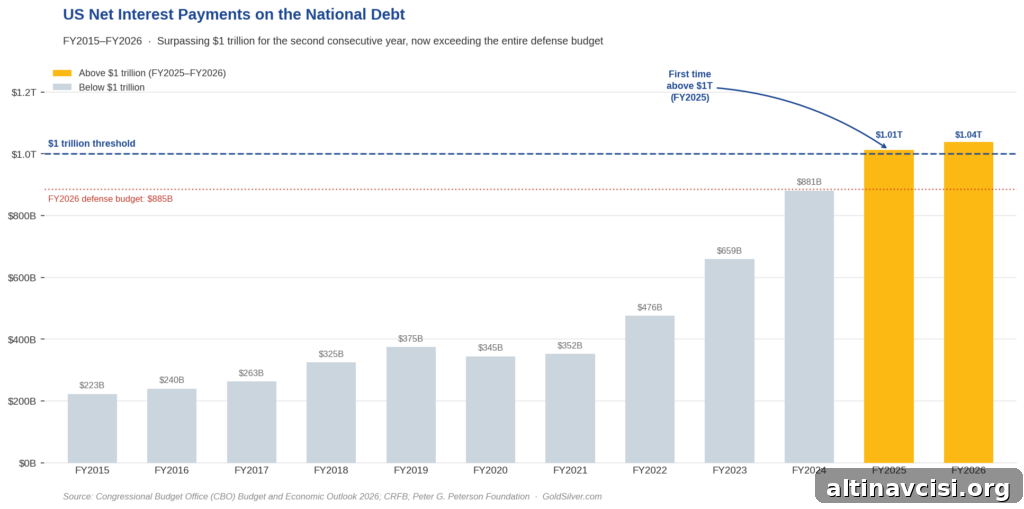
That same week the Congressional Budget Office confirmed what many analysts had been warning: the federal government will pay more than $1 trillion in interest on the national debt in fiscal year 2026. This is the second consecutive year that interest costs have passed that threshold.
Why Does $1 Trillion in Annual Debt Interest Matter?
The $1 trillion annual interest bill now exceeds the entire defense budget, which was enacted at $885 billion for fiscal year 2026. It also outpaces federal spending on major domestic priorities such as Medicaid, transportation, education, and veterans’ benefits when combined. Only Social Security and Medicare are larger federal programs.
Unlike most spending categories, interest payments produce no public goods or services. Interest is the cost of past borrowing: every dollar paid to service debt is a dollar that cannot be used to build infrastructure, fund military readiness, improve healthcare, or expand education. Those are direct economic and social consequences of rising debt service.
The CBO projects interest costs will climb to $2.1 trillion annually by 2036. Looking further ahead, the CBO’s long-term projections suggest that by the 2040s net interest could overtake every other budget line item, including major entitlement programs. If that projection materializes, interest would become the single largest federal expenditure, reshaping budget priorities for decades.
What Is Fiscal Dominance, and Why Is It Bullish for Gold?
Economists call this dynamic fiscal dominance: a situation in which growing public debt begins to dominate monetary policy. In practice, the weight of servicing the debt constrains central-bank decisions. Instead of independent monetary policy driving interest rates, the requirements of the fiscal balance increasingly influence rate outcomes.
The signs are visible in current market pricing and central bank behavior. The Federal Reserve met on April 28–29, and market tools showed very high odds that the Fed would hold its policy rate at 3.50%–3.75%. That expectation was not necessarily because inflation was fully under control — the Bureau of Labor Statistics reported the Consumer Price Index at 3.3% for March 2026 — nor because the economy was clearly expanding, given indicators such as the Institute for Supply Management’s services employment index falling to a contractionary reading.
The Fed is effectively trapped: cutting rates risks accelerating inflation and eroding real incomes, while raising rates further would sharply increase the federal interest bill and compound fiscal strain. Either path has hard consequences, and the fiscal arithmetic narrows the Fed’s options. That constraint is one reason why precious metals like gold are attractive to market participants looking for protection against policy-driven currency dilution or unexpected inflationary episodes.
The Edge Every Investor Needs
Smarter precious metals insight and timely market commentary to help you follow trends in gold and silver.
How Does the Debt Problem Translate Into Gold and Silver Prices?
Fiscal dominance tends to push real yields lower. Real yields are the returns savers receive after accounting for inflation. When real yields are low or negative, cash and nominal bonds lose purchasing power over time. In that environment, non-yielding assets that preserve purchasing power — like gold and silver — often outperform financial assets that offer fixed nominal returns.
Gold and silver cannot be created by central banks on a whim. Global mined supply grows at roughly 1–2% per year, independent of monetary policy. That scarcity, along with long-standing cultural and industrial demand, helps explain why precious metals act as a store of value when fiat currency purchasing power is in question.
Gold’s roughly 41% gain over the most recent twelve months is a market signal: traders and investors are pricing in constrained policy options, rising fiscal burdens, and a lower likelihood of sustained positive real yields. This is not necessarily a sign of imminent panic; it can be seen instead as the market adjusting to structural economic limits.
There is a reasonable counterargument: if the Fed were to raise rates aggressively to break inflation, real yields would rise and that would pressure gold prices. That remains a possibility. But aggressive hikes when the federal interest bill already exceeds $1 trillion would worsen fiscal strain and could slow the economy dramatically. Historical episodes show that when debt levels are small relative to GDP, central banks have more freedom to tighten strongly; when debt is high, that freedom narrows. Today’s debt-to-GDP ratio leaves much less room for a Volcker-like rate response without significant secondary effects.
The $1 trillion annual interest figure is not merely a headline; it is a structural data point that markets will use to price risk, policy flexibility, and safe-haven demand. If central banks ever attempt a sustained, forceful campaign against inflation, the resulting increase in debt-service costs would make the fiscal constraint obvious to a wider audience and could intensify demand for precious metals as hedges.
SOURCES
1. Congressional Budget Office — Monthly Budget Review: Summary for Fiscal Year 2025; The Budget and Economic Outlook: 2026 to 2036; The Long-Term Budget Outlook: 2025 to 2055
2. Congressional Research Service — FY2026 Department of Defense Appropriations: In Brief
3. Bureau of Labor Statistics — Consumer Price Index: March 2026
4. Institute for Supply Management — Services PMI Report: March 2026
5. Federal Reserve — FOMC Meeting Calendar 2026; Minutes of the FOMC Meeting, March 17–18, 2026
6. London Bullion Market Association — Gold and Silver Price Data
7. World Gold Council — Gold Supply Data
By the GoldSilver Editorial Team — helping investors understand sound money since 2005. This article is for informational purposes only and does not constitute financial, investment, or tax advice. Always consult a qualified financial advisor before making investment decisions.
You May Also Like:
- 5 Signals That Say Gold’s Bull Case Just Got Stronger
- The Largest Gold ETF Outflow Ever – But China Disagrees
- Silver Market Deficit 2026: Six Years and Getting Worse
- Is the Petrodollar Ending? What the Iran War Means for Gold
- France’s Gold Repatriation Is Done. Germany Is Next
- Gold/Silver Ratio Hits 61.1 — Silver’s Turn to Run
- Silver Holds Near $80 as Iran Ceasefire Revives Rate-Cut Bets
- The Fed Goes Silent in 3 Days – What Does That Mean For Gold?
Popular Topics
Picked from the archive
-
01
 Topics
Money Manager Sues Fed Chair Powell to Force Public Rate Talks
-
02
Topics
Kansas City Fed President Urges Steady Rates Amid High Inflation
-
03
Topics
Industrial Demand Sends Silver and Platinum 28% Ahead of Gold
-
04
Topics
Swiss Precious Metals Association Warns on 39% US Gold Tariffs
-
05
Topics
Gold Pulls Back as US and China Sign New Trade Deal
-
06
Topics
Gold Drops on Trade Optimism; Dollar, Fed Cuts Lend Support
-
07
Topics
Gold Price Today: Why This Week Could Spark a Rally
-
08
Topics
Why Gold Is Outperforming Nvidia in 2025