Rising PCE Inflation, Sluggish Growth, and a Lingering Oil Crisis
🌅 Morning News Nuggets | Today’s top stories for gold and silver investors
April 9th, 2026 | Brandon Sauerwein, Editor
PCE inflation for February 2026 surprised to the upside — and that’s not the only data point investors should watch this week. Below is what the release means for interest rates, gold and silver, and the outlook for markets through the coming days.
Ceasefire or Not, the Energy Crisis Isn’t Over Yet
Oil rebounded toward $97 per barrel on Thursday after an enormous one-day drop. On Wednesday, WTI plunged more than 16% following reports that the United States and Iran agreed to a temporary two-week ceasefire. Markets initially relaxed on the headlines, but further details revealed disagreements over the scope and terms of the arrangement.
Iran’s leadership publicly said the U.S. violated key points of Tehran’s proposal, citing continued strikes in neighboring Lebanon, a drone incursion and a refusal to acknowledge Iran’s enrichment rights. U.S. and allied officials disputed that characterization. The lack of clarity matters: shipping through the Strait of Hormuz — which carries about one-fifth of global daily oil flows — remained largely halted. Tanker transits stayed extremely limited, and maritime traffic did not return to normal.
In short, the ceasefire headlines eased short-term fear, but the physical disruption to supply remained unresolved. Until shipping and insurance conditions normalize through Hormuz, oil markets will stay sensitive to further escalation, keeping energy-driven inflation risks elevated.
What the PCE Report Means for Interest Rates
This morning the Bureau of Economic Analysis released the February Personal Consumption Expenditures (PCE) Price Index — the Fed’s preferred inflation gauge. Headline PCE rose 2.8% year-over-year in February, above consensus and unchanged from January. Month-over-month, headline and core PCE both increased by 0.4%. Core PCE — which excludes food and energy — is running at roughly 3.0% year-over-year, well above the Fed’s 2% target.
There are two important subtleties. First, personal income fell in February while consumers spent more, leaving real disposable income down materially. That combination (rising spending on falling incomes) is not durable. Second, energy price pressures tied to the Strait of Hormuz disruption, combined with tariff-driven pass-through into goods prices, are shifting the inflation backdrop higher than many expected at the start of the year.
Taken together, the data narrows the Federal Reserve’s policy options. Markets have moved to price near-zero odds of a rate cut through the summer; today’s hotter PCE print makes cutting rates this year even less likely. In other words, the path to looser policy has become steeper, and that has direct implications for real yields, the dollar and precious metals.
Is the U.S. Economy Slowing While Prices Stay High?
The BEA also published the final Q4 2025 GDP estimate this morning. Growth was revised down to a 0.5% annualized rate, a sharp slowdown from Q3’s 4.4% pace. That’s not merely a deceleration — it’s a near stall in expansion. Layer that weak growth onto persistent inflation and the risk of stagflation becomes clearer: output is cooling while prices remain elevated.
This mismatch creates a policy dilemma for the Fed. Cutting rates risks reigniting inflation. Holding rates higher for longer deepens the drag on an already slowing economy. The tension between these outcomes is now showing up in market pricing and in asset behavior.
Keep in mind the Q4 GDP numbers predate the Iran war, the recent oil shock and tariff escalations. Early Q1 data are likely to reflect those new pressures and could paint an even more challenging picture when released.
Gold Pushes Higher to Around $4,800 as Uncertainty Persists
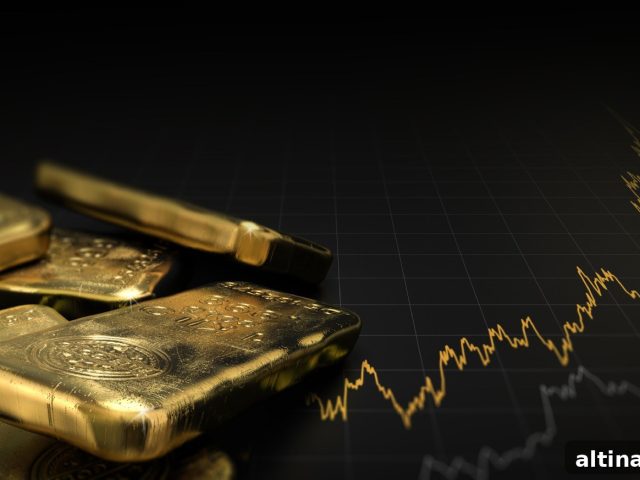
Gold traded near $4,746 per ounce this morning, continuing a multi-day rebound from recent lows. The brief calm following the ceasefire announcement did not hold; buyers returned as the energy disruption and inflation readings raised recession and policy risks simultaneously.
Over the past year gold’s trading range has been wide, reflecting a volatile macro picture: from roughly $2,970 to a peak near $5,595. Although current prices sit below the cycle high, gold remains significantly higher than a year ago. Institutional and central-bank demand, ETF inflows, and long-term concerns about debt and monetary credibility have supported the metal through bouts of volatility.
Gold strategists at major firms continue to point to structural support: central bank purchases from emerging markets, continued investor flows, and physical demand driven by concerns about currency debasement and rising debt burdens. The current mix of higher inflation, geopolitical risk and a slowing economy fits that support thesis.
Will Tomorrow’s CPI Confirm the PCE Momentum?
On April 10 the Bureau of Labor Statistics releases the March Consumer Price Index. February’s CPI looked relatively contained at 2.4% year-over-year, but that reading came before the recent oil spike and tariff pass-through into goods prices. March may be the first CPI print to capture both effects. A hotter-than-expected CPI would further tighten the Fed’s policy path and strengthen the case for holding real assets such as gold and silver as inflation hedges.
The Edge Every Investor Needs
Smarter precious metals investing starts here. The Nuggets Newsletter delivers market insights, Fed updates, global trends and educational content for gold and silver investors.
SOURCES
1. Bureau of Economic Analysis — Personal Income and Outlays, February 2026
2. Bureau of Economic Analysis — GDP Second Estimate, Q4 2025
3. CME Group — FedWatch Tool
4. CNN — coverage of oil and market moves following ceasefire reports
5. CNBC — reporting on ceasefire disagreements and statements from Iran
6. Bloomberg — reporting on diplomatic talks and Hormuz shipping disruptions
7. U.S. Energy Information Administration — energy market context
8. Morningstar — analysis of PCE and goods-price pass-through
9. TheStreet — coverage of gold price dynamics and analyst views
10. Investing.com — historical gold spot price data
11. Bureau of Labor Statistics — Consumer Price Index schedule
This article is for informational purposes only and does not constitute financial or investment advice. Consult a qualified financial advisor before making investment decisions.
You May Also Like
- The Fed Is Stuck. Here’s What That Means for Gold.
- Iran Ceasefire Sends Gold to $4,800 — Now What?
- War Risk, Stagflation Signals, and a $6,300 Gold Target
- Gold and Oil Brace for the Strait of Hormuz Deadline
- Iran War Deadline Puts Gold and Silver Prices on Edge
- Why Is Gold Falling When the World Is on Fire?
Popular Topics
Picked from the archive
-
01
 Topics
Serbia Repatriates USD 6B in Gold Reserves From Overseas Vaults
-
02
Topics
How Real Interest Rates Drive Gold Prices: Investor Guide
-
03
Topics
Gold Prices Slip After Rally as Fed Rate Cut Looms
-
04
Topics
Gold Rises Amid Fed Uncertainty, Weak Jobs and Crypto Turmoil
-
05
Topics
Why BRICS Nations Are Stockpiling Gold
-
06
Topics
High Earners Falling Behind on Credit Cards and Auto Loans
-
07
Topics
Gold Prices Slip as Fed Officials Delay December Rate Cut
-
08
Topics
Extra $21 Billion in Tariff Revenue Fails to Stem the Deficit