Gold Slumps 14% in March as Inflation Lingers
🌅 Morning News Nuggets | Today’s top stories for gold and silver investors
March 31st, 2026 | Brandon Sauerwein, Editor
Gold prices and inflation in 2026 are being driven by a single, dominant pressure point: the Middle East conflict and its ripple effects on energy, commodities, and Federal Reserve policy. Below is a clear summary of what moved markets in March and why investors should care.
Why Are Gas Prices Surging — and How High Could They Go?
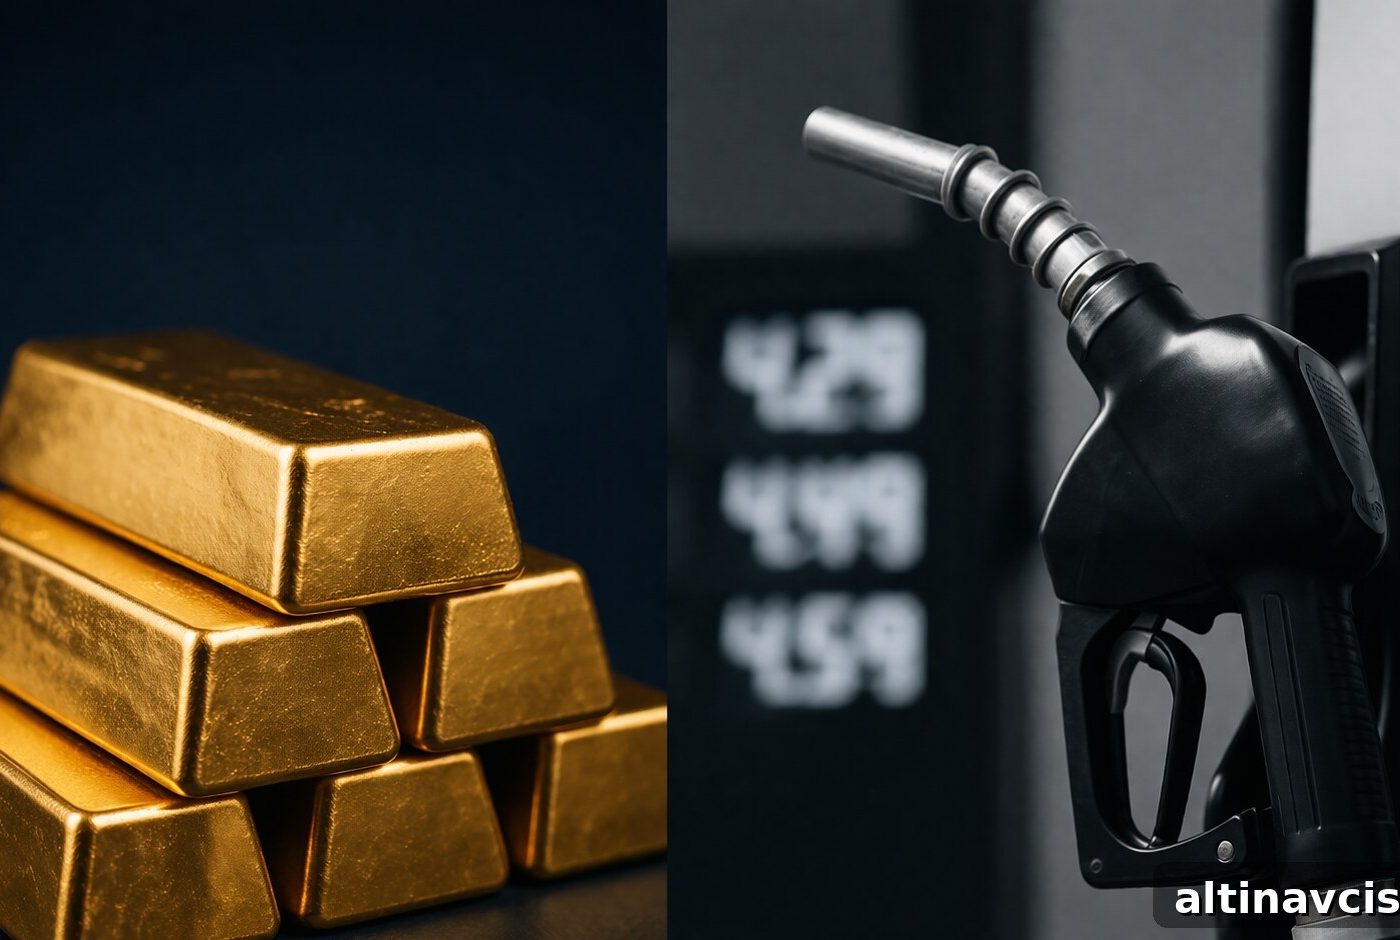
American drivers are feeling an abrupt squeeze at the pump. The national average price of gasoline rose roughly 27 cents in a single week in late March, jumping from about $3.00 to $3.48 per gallon as deliveries and shipping routes in the Persian Gulf stalled. This is not a slow climb but a fast shock to supply chains and consumer budgets.
Regionally, prices vary widely. California stands out with an average near $5.34 per gallon — more than $1.75 above the national average — while states like Kansas are closer to $3.01. That $2.33 spread illustrates how local markets, taxes, and refinery access create very different experiences for drivers across the country.
The pressure begins upstream with crude. Brent crude traded around $111 per barrel as of March 30 — nearly $38 higher than a year earlier — and crude remains the largest cost component in every gallon of gasoline. Analysts describe current conditions as “uncharted,” and the timeline for relief is uncertain: when oil spikes, pump prices move quickly; when oil falls, retail prices typically lag.

Why Is Gold Down 14% in March — and Is the Selloff Overdone?
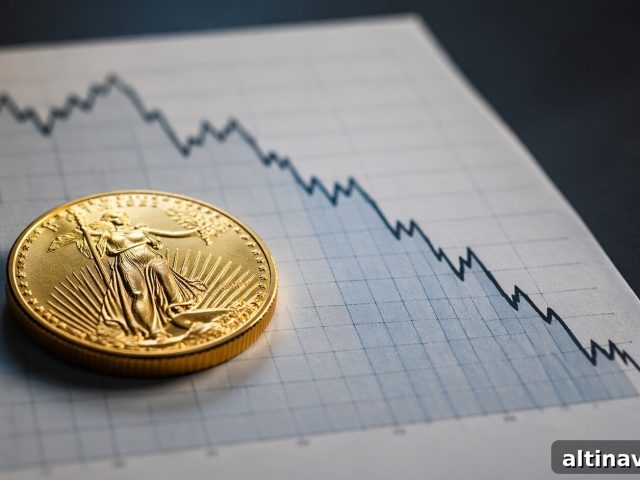
March looks set to be gold’s worst month since October 2008, with prices falling roughly 14% during the period. The decline is not primarily about demand collapsing; it’s about expectations for monetary policy shifting quickly. Earlier this year markets priced in two Federal Reserve rate cuts; those expectations have largely evaporated as rising energy costs have renewed inflation concerns.
The Fed held its policy rate at 3.50–3.75% in March, and with crude oil climbing, the chance of earlier rate cuts diminished. Higher rates increase the opportunity cost of holding non-yielding assets like gold, which helps explain the rapid selloff.\u00a0
The retreat was broad: silver, platinum, and palladium each dropped near 20% in March, signaling a widespread pullback across precious metals rather than a problem unique to gold. Short-term moves, however, can be volatile. Gold ticked up after reports suggesting a possible diplomatic de-escalation, but such rallies can be fleeting.
Longer-term views still differ. Some institutional forecasts continue to argue for higher year-end gold prices, pointing to central bank diversification, sustained demand, and the possibility of eventual Fed easing. That creates a notable gap between current prices and some analyst targets — a gap investors will be watching closely as policy and geopolitical signals evolve.
Why Is Aluminum Up 10% This Month — and What Does It Mean for Prices?
While gold and oil grab headlines, aluminum quietly posted one of its strongest months in nearly two years. Three-month futures on the London Metal Exchange rose roughly 10% in March, the largest monthly gain since April 2024. The proximate cause is geographic: the Persian Gulf region accounts for a meaningful share of global aluminum production, and disruptions to the Strait of Hormuz have effectively cut that supply.
Targeted strikes have struck production facilities in the region, and analysts warn that sustained damage could flip the aluminum market from a modest surplus into a substantial shortage. Aluminum’s role in construction, automotive manufacturing, and packaging means price increases can quickly feed into broader cost pressure: higher construction budgets, increased car prices, and heavier costs in consumer goods.
Other industrial metals such as copper, zinc, and nickel weakened in March, making aluminum’s breakout performance particularly notable. When one commodity diverges during a wide market correction, it often reflects a specific supply shock rather than a broad demand surge.
Did You Know Gold Trades $361 Billion Per Day?
Many investors think of gold as a classic safe haven, but it is also one of the most actively traded assets worldwide. In 2025, average daily trading volume in gold reached about $361 billion across global markets — comparable to the daily activity in 10-year U.S. Treasuries, a global benchmark for liquidity.
Gold’s liquidity profile goes beyond sheer volume. Its intraday volatility is often similar to or lower than long-dated government bonds, and bid-ask spreads have remained narrow even during stressed periods. Unlike bonds or bank deposits, gold carries no issuer or counterparty risk, and it is not subject to the same default or credit events that can impair other assets.
These characteristics underpin a growing argument among some market participants and industry groups that gold merits classification as a High Quality Liquid Asset (HQLA). The case rests on consistent volume, stable volatility, and demonstrated liquidity under stress — attributes that matter to institutional investors and regulators evaluating balance-sheet treatment.
The Fed Says 2.7%. The OECD Says 4.2%. Someone Is Wrong.
A key divergence emerged in March between the Federal Reserve’s inflation outlook and independent forecasters. The OECD raised its U.S. inflation forecast for 2026 to about 4.2%, up significantly from previous estimates and well above the Fed’s 2.7% projection. That gap matters because it highlights a credibility challenge for policymakers if energy-driven price pressures prove more persistent than expected.
In its baseline view the OECD expects the Fed to keep policy rates steady through 2027, given higher headline inflation, elevated core inflation projections, and resilient GDP growth. While the OECD did not call explicitly for rate hikes, it warned that policy adjustments could become necessary if price pressures broaden or labor market conditions weaken. For investors banking on rate cuts to fuel the next gold rally, this forecast pushes that timeline farther out and raises the stakes on geopolitical and energy developments.
Stay On Top of Gold & Silver Prices
Sign up for concise market alerts and timely analysis delivered to your inbox.
Free guide: “What Happened in 1971? The moment our financial system changed.” To receive the guide and periodic market updates, subscribe via the site’s newsletter form.
Sources: The Mirror; Bloomberg; CNBC; World Gold Council; OECD
You May Also Like
- Gold Bounces as Iran, the Fed, and the Dollar Collide
- Iran Rejects Talks as Gold and Silver Extend Slide
- Is Gold Still a Safe Haven During War?
- Gold Safe Haven Bid Returns After Nine-Day Selloff
- Gold Price Correction Settles as Saudi Arabia Eyes Iran War
- What’s Driving Gold’s Sharpest Pullback of the Year
Popular Topics
Picked from the archive
-
01
 Topics
High Earners Falling Behind on Credit Cards and Auto Loans
-
02
Topics
ETF Inflows Propel Gold Demand to Highest H1 Levels Since 2020
-
03
Topics
Dollar Hits Two-Month High as Powell Pauses Rate-Cut Hopes
-
04
Topics
Powell’s Rate-Cut Dilemma: Trump vs Fed Credibility
-
05
Topics
Will Policy Reversal Move Gold? Conflict Pressure Index Insight
-
06
Topics
Why Gold Drops During an Oil Price War
-
07
Topics
Gold Prices Rise for Seventh Week as Jobs Data Goes Dark
-
08
Topics
US Copper Price Surge Threatens Business Costs