Why Gold Prices Fell After the Oil Shock
🌅 Morning News Nuggets | Today’s top stories for gold and silver investors
March 20th, 2026 | Brandon Sauerwein, Editor
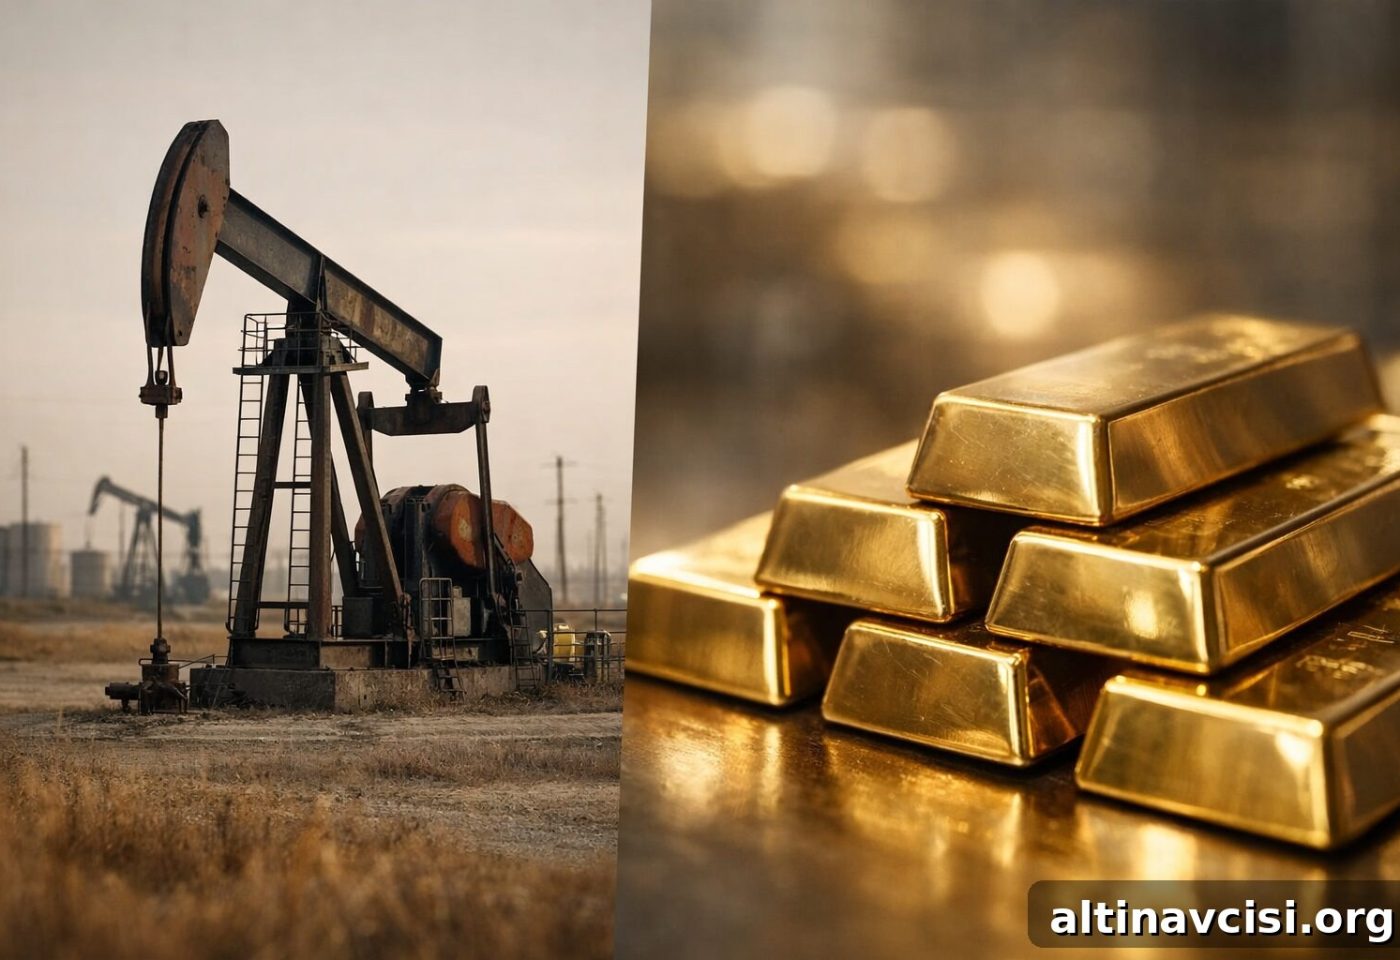
If you watched gold fall nearly 9% this week while oil surged past $119, it probably didn’t make sense. The gold price drop after the oil shock isn’t what it appears to be. Here’s the full picture.
Is an Oil Shock Bullish or Bearish for Gold?
The immediate market driver right now is oil, not gold. Brent crude has surged past $119 per barrel this week. That represents roughly an 80% increase since the conflict began, largely because tanker traffic through the Strait of Hormuz has been nearly halted. The result is a renewed inflation impulse hitting economies that were already struggling to bring price growth under control.
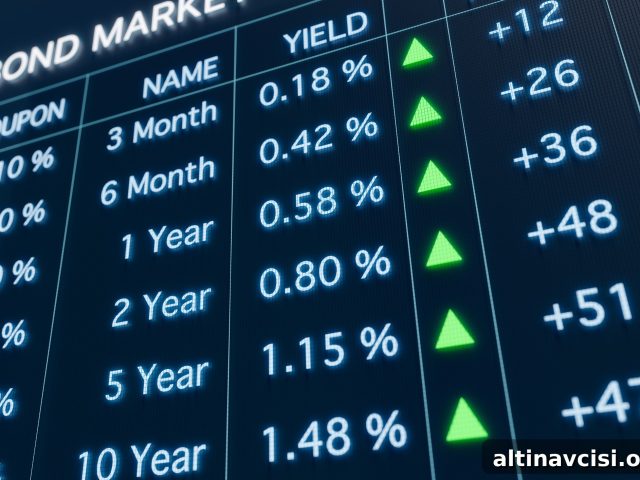
That creates a dilemma for central banks. Higher energy costs flow straight into consumer prices, making inflation more persistent and likely keeping interest rates higher for longer. Rising real yields and a stronger dollar typically put near-term pressure on gold. So the sharp drop in gold prices after the oil shock is largely a paper-market phenomenon, but the macroeconomic consequences are very real.
That’s the near-term headwind. Yet history offers a different lens. Energy-driven inflation shocks not only raise prices; they also reveal structural vulnerabilities — higher debt burdens, constrained monetary policy, and slowing growth. Those conditions have historically driven investors toward gold, not as a speculative trade but as a hedge and portfolio necessity.
The pressure on gold today is palpable. Equally important is the argument for what may follow once the initial volatility settles.

The Edge Every Investor Needs
Smarter precious metals investing starts here. The Nuggets Newsletter brings you essential market insights, Fed updates, global trends, educational videos, and much more.
If the Strait of Hormuz Stays Closed, How High Could Oil Go?
Saudi energy officials have run scenarios, and their base case is worrying: if disruptions at the Strait of Hormuz continue into late April, oil prices could move toward $150, then $165, and potentially $180 per barrel. Such a pace of increase would constitute one of the most severe energy shocks in modern memory.
Crucially, Saudi Arabia does not welcome a spike of that magnitude. A rapid price surge risks crushing demand — consumers pull back, growth slows, and the oil market itself becomes unstable. The kingdom prefers higher, steady prices; it does not want a spike that triggers a sharp economic pullback.
Economists estimate that crude near $138 per barrel would push the odds of a global recession above 50%. That level would be less a cap and more a dangerous waypoint on the path toward wider economic strain.
Energy shocks of this scale leak into every corner of the economy: food costs, shipping, manufacturing and more. All of this pressure arrives at a time when central banks have limited room to ease, increasing the risk to both economic activity and financial stability.
Is Inflation Really Under Control? Here’s What the Fed’s Number Leaves Out
When Chair Powell described inflation as “somewhat elevated,” he was referring to core PCE at 3.0%. That measure purposely excludes food and energy. It’s useful for tracking underlying price trends, but it’s less helpful for households paying for groceries and fuel.
Here are the excluded categories and how they moved over the past year:
- Food up 3.1% — groceries up 2.4%, restaurant meals up 3.9%
- Beef up 14.4%
- Natural gas up 10.9%, electricity up 4.8%
- Gasoline down 5.6% — a decline that looks set to reverse sharply
Importantly, these figures were recorded before the recent conflict began. Since then gasoline prices have already rallied about 15%. Analysts now expect headline CPI to rise to roughly 3.3% in March — and that projection does not yet capture the secondary effects of higher fuel costs on food transport, shipping, and manufacturing.
Core PCE at 3.0% is already well above the Fed’s 2% goal. The broader inflation picture is more troubling, and the March data has yet to arrive in full.
Is Gold’s Biggest Weekly Drop Since Covid a Warning — or a Reset?
Gold is recovering some ground this morning. Spot prices are up modestly after a steep weekly slide. Earlier this week gold experienced its largest one-week percentage decline since the pandemic era — nearly 9% — while silver fell about 10%. On the surface that looks alarming, but the underlying drivers tell a different story.
This was not a fundamentals-driven selloff. Instead, it reflected dynamics in the paper and futures markets. When the Iran conflict escalated and oil spiked, gold initially rose, then reversed sharply as leveraged futures traders faced margin calls and liquidated positions. Throughout this volatility, physical premiums for gold remained elevated and demand from long-term buyers — stackers, institutions and jewelers — held firm. The physical market did not evaporate.
As one analyst observed, much of the money that chased gold’s 2025 rally was momentum capital, not long-term allocation. That capital often exits quickly when markets turn. The buyers left standing after that rotation tend to be central banks and long-term holders. Historically, such a cleansing of short-term flows can set the stage for the next leg higher in price, rather than signaling a durable bear market.
Do Central Banks Buy More Gold When Prices Fall?
When gold drops sharply, retail investors often sell and hedge funds cover positions, creating dramatic headlines. But central banks usually keep buying. Over recent years central bank purchases have been a steady source of demand.
For example, after a large price decline in 2022, central banks purchased more than 1,000 tonnes of gold — the highest annual total since mid-century. They continued buying heavily in 2023 and 2024, even as rate hikes and a stronger dollar pressured prices. While purchases slowed somewhat in 2025 as prices set records, annual buying still remained well above the long-term average. Entering 2026, a substantial share of central banks signaled plans to increase holdings rather than reduce them.
A caveat: official monthly data for February and March are not yet published, so those totals could shift. What the multi-year trend shows is that price dislocations tend to create buying opportunities for long-term institutional buyers rather than altering their broad strategy.
Stay On Top of Gold & Silver Prices
Get important market alerts sent straight to your inbox.
You May Also Like
- Gold Price Drop Today — War Rages as the Debt Hits $39 Trillion
- Gold Price Outlook: Fed Holds, PPI Climbs
- Gold Price Today Holds at $5,000 — What’s Driving It
- Gold Price Forecast 2026: Fed, Iran, and the $6,000 Question
- Gold and Silver Prices Today: Stagflation, the Fed, and What Comes Next
Popular Topics
Picked from the archive
-
01
 Topics
Japan Election Promises and Tariff Fears Rattle Bond Market
-
02
Topics
Global Oil Prices Steady as Travel Demand Rises, Sanctions Loom
-
03
Topics
Gold Holds Above $5,000 as Hedge Funds Brace for Volatility
-
04
Topics
Why Central Banks Are Buying Gold Amid Market Turmoil
-
05
Topics
Gold Hits $4,000: Wake-Up Call for Markets and Policymakers
-
06
Topics
Oil Price Rebounds to $69 as US-EU Trade Deal Nears
-
07
Topics
Gold Prices Surge as Middle East Tensions Escalate
-
08
Topics
Rare Earth Metals Driving the Global Economy