
Silver is trading around $67.25 per ounce, while UBS’s year-end projection is $70. That difference of roughly 4% is the main development this week. It highlights an important point UBS’s headlines have not emphasized: the market’s move is already underway. UBS is updating a forecast that appears to be catching up with price action, rather than initiating a new rally.
What Did UBS Actually Say on September 21?
UBS restated the silver price path it first published on August 29: $70 by December 2026, $75 by March and June 2027, and $80 by September 2027. Strategists Wayne Gordon and Dominic Schnider confirmed the same trajectory in a September 13 update and repeated it again on September 21. Their framing describes silver as a “high-beta version of gold,” meaning silver tends to move more sharply than gold because it also carries industrial demand that gold does not.
Those numbers are not new — they are a reiteration of a forecast announced weeks earlier. What has changed is the market environment. The Federal Reserve raised its policy rate by 25 basis points in September, which strengthened the dollar. A firmer dollar and higher rates normally put pressure on non-yielding assets like silver. UBS’s economists had already anticipated the hike, yet silver climbed regardless. That price action suggests the market is following its own dynamics rather than responding solely to analysts’ revisions.
The Edge Every Investor Needs
Smarter precious metals investing starts here. The Nuggets Newsletter brings key market insights, Fed updates, global trends, and educational content to help you stay informed.
Is the Gold-Silver Ratio the Real Story Here?
A more revealing metric than any single price target is the gold-silver ratio — how many ounces of silver buy one ounce of gold. On September 14 the ratio was about 67.98; the latest reading is near 64.90. Over six consecutive sessions, silver has narrowed the gap with gold. That compression happened even as the Fed raised rates, a move that normally favors the dollar and pressures non-yielding metals.
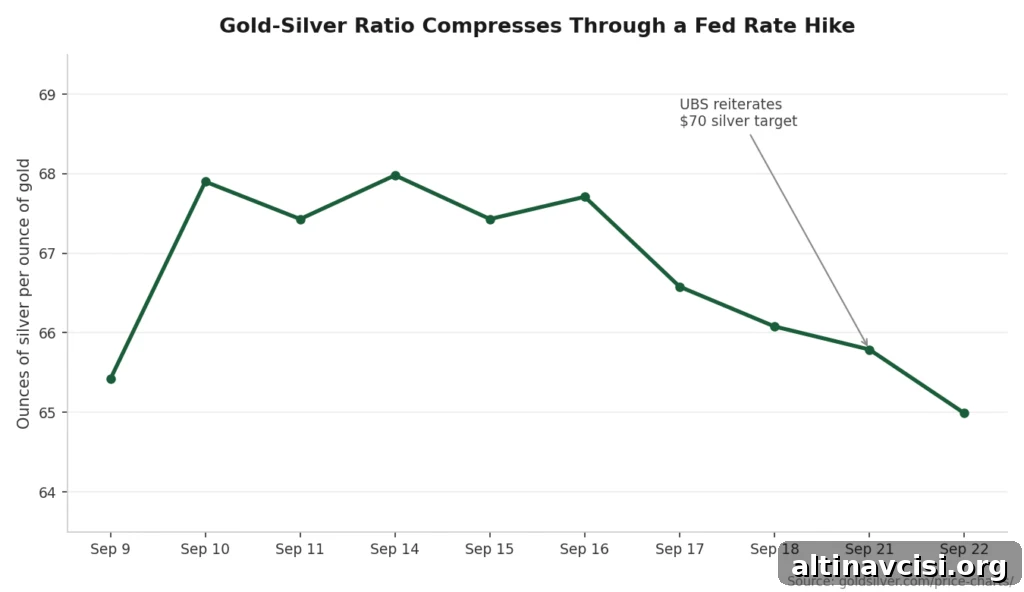
A declining ratio means silver is outperforming gold. This is an observable market trend rather than a speculative forecast. Historically, the long-run average ratio has ranged around the mid-40s to mid-60s ounces of silver per ounce of gold. Today’s reading sits near the higher end of that range but is not yet at extreme levels — levels above 80 historically have preceded the most dramatic silver rallies. Importantly, the current move is a continuation rather than a sudden reversal, and it follows the short-term developments discussed in earlier market notes.
Is UBS Turning Bullish on Silver?
Not exactly. UBS spent much of the first half of 2026 lowering its silver outlook. In May the bank sharply reduced its estimate of a 2026 supply deficit — from about 300 million ounces to roughly 60–70 million ounces — and trimmed its price targets accordingly. The second-quarter target dropped from $100 to $85, year-end from $85 to $80, and the March 2027 forecast from $85 to $75. At that time UBS expected silver to trade “broadly sideways.”
Those cuts reflected genuine market concerns. The Silver Institute projected a significant decline in silver demand from the solar sector in 2026 — roughly a 19% drop to an estimated 151 million ounces — citing substitution and thrifting by major panel manufacturers. That reduction in industrial demand is a real headwind, independent of UBS’s research.
Since late August, UBS has held its forecasts steady rather than cutting them further. The September 21 note leans on gold’s relative strength and rising concerns about U.S. fiscal stability and long-term dollar purchasing power as reasons why silver could keep pace. That is a plausible mechanism: market participants are pricing in currency risk even as the Fed tightens policy. Still, this is a continuation of August’s forecast rather than a fresh bullish upgrade, and some of the more enthusiastic language in news headlines overstates the substance of the published note.
What Does This Mean for the Individual Saver?
Analyst price targets are useful but ultimately represent opinions that change frequently. By contrast, the gold-silver ratio is a market-priced metric updated every session. For an investor holding physical metal, the ratio’s recent compression — silver buying more gold ounce for ounce over multiple sessions — is a concrete signal that reflects real buying and selling, not only research revisions.
This distinction matters because paper flows (such as ETF movements) and physical metal ownership don’t always move in the same direction. Tracking the ratio and actual market prices provides a direct view of how the two metals perform relative to each other. For long-term savers who hold metal rather than exposure through derivative or paper instruments, that relative performance can be a more durable indicator than periodic research updates.
Stay On Top of Gold & Silver Prices
Get important market alerts sent straight to your inbox.
SOURCES
1. GuruFocus – Silver Price Forecast: UBS Predicts Strong Growth Ahead (September 21, 2026)
2. ExchangeRatesUK – Silver Price Forecast: UBS Holds $70 December Prediction (September 13, 2026)
3. ExchangeRatesUK – UBS Targets $80 After Warsh Selloff (August 29, 2026)
4. Yahoo Finance – UBS Resets Silver Price Target for Rest of 2026 (May 14, 2026)
5. CNBC – Fed Rate Decision September 2026: Rates Rise to 3.75%-4% (September 16, 2026)
6. PV Magazine – Silver Demand From PV Industry Expected to Drop 19% This Year (April 15, 2026)
Disclaimer: This article is informational only and does not constitute investment advice. Past performance is not indicative of future results. Consult a qualified financial advisor before making investment decisions.
You May Also Like:
- China Imported 1,000+ Tonnes of Gold in Eight Months. Its Central Bank Bought Only 80.
- Fed Officials Turn Hawkish. Gold’s Iran-Diplomacy Bounce Can’t Hold.
- Bernstein Just Cut Its Gold Forecast — By Breaking Gold’s Oldest Rule to Defend It.
- The Fed Just Hiked. Wall Street Keeps Getting More Bullish on Gold Anyway.
- Gold Dips, Silver Holds as Iran Diplomacy Hopes Sink Oil Before a Bigger Week.
- Silver Round-Tripped a 6.8% Shock in Nine Days. Real Yields Did It, Not Inflation.
- Iran Hit a Tanker in Hormuz and Trump Threatened Iran. Oil Isn’t Reacting.
- Rates Just Went Up Twice. Five Reasons Gold Didn’t Care.