Why Silver’s Price Floor Just Reset to $70
Key Takeaways
- Throughout 2024 and early 2025, silver traded mostly in a $29–$35 range before beginning a dramatic rally that shifted market expectations.
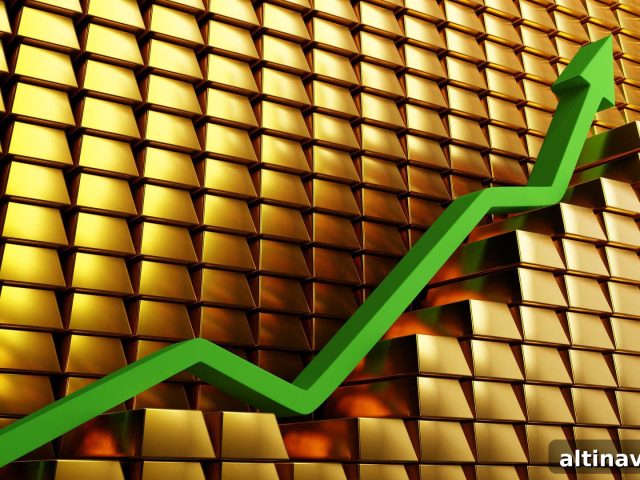
- The price crossed $40 in September 2025, $50 in October, $60 in December, and reached an intraday high of $121.67 on January 29, 2026.
- After retreating more than 40% from that high, silver was trading around $70 as of March 30, 2026 — still more than 100% above its level a year earlier.
- Unlike the fully retraced rallies of 2011 and 2020, this episode stabilized at levels well above the previous baseline, which is consistent with a structural repricing rather than a temporary spike.
Silver spent much of 2024 and early 2025 range-bound in the low $30s. Between March 2025 and late January 2026, the metal surged from roughly $34 to an intraday peak of $121.67 — an extraordinary gain of over 250% in less than a year. The subsequent pullback was sharp, with prices retracing more than 40% from that peak. By March 30, 2026, silver traded near $70, a level that remains substantially higher than the price one year earlier.
That elevated post-rally price is important when evaluating whether the move was a fleeting mania or a lasting shift. The peak itself proved unsustainable, but the market’s stabilization well above prior ranges raises the possibility that silver’s baseline has been redefined. The central question now is whether the roughly $70 area will act as a new structural floor for the metal.
Silver Spot Price · XAG/USD
6-Year Price History
Jan 2020 – Mar 2026 · Daily closes · USD / troy oz
$70.51
▲ +295% since 2020
$11.98
6-Yr Low
$116.61
6-Yr High
+107%
YoY Return
$70.51
Current
Data: GoldSilver.com
GoldSilver.com
What Does a “Price Floor” Actually Mean in Silver Markets?
A price floor is a level where buying interest consistently absorbs selling pressure, creating a reliable area of support. It is not an absolute guarantee, but if silver holds substantially above a former trading band after a major rally, that behavior points to a revaluation of the asset. When a new range attracts real two-sided demand rather than only one-sided speculative interest, it can become the baseline from which future gains or declines occur.
Before the rally, silver was largely confined to a $29–$35 zone through 2024 and into early 2025. That range represented many years of limited upward discovery. As the market broke higher — registering successive milestones at $40, $50, $60 and eventually the four-figure tension crossing $100 in January 2026 — each step drew new participants and testing points. The consolidation near $70 after the peak can be read as an attempt by the market to locate where genuine, sustainable demand lives.
If that consolidation endures, $70 would represent a major upward shift in silver’s structural support — effectively doubling the baseline that defined the market for much of the previous decade.
How Did Silver Rise From $34 to $121 in Less Than a Year?
The rally was driven by several converging forces rather than a single trigger. Fundamental industrial demand rose sharply, monetary conditions favored tangible assets, the gold-to-silver ratio signaled relative undervaluation, and technical breakout patterns invited momentum buying.
Industrial consumption is a critical foundation. Silver is essential in solar panels, electric vehicles, electronics and medical devices. Fabrication demand reached record levels in recent years as renewable energy deployment and electrification accelerated. That persistent, non-speculative demand differentiates the 2025–2026 move from earlier sentiment-driven surges.
Monetary and macro conditions also helped. A weaker dollar and elevated inflation pressures made hard assets more attractive as long-term allocations. Meanwhile, the gold-to-silver ratio, which had been unusually high, began to compress as gold rose — creating room for silver to catch up. Technically, a long-term breakout pattern culminated in a rapid sequence of price milestones that fed on momentum and short-covering, pushing the metal through multiple resistance levels in quick succession.

What Happened in 1971?
The guide that explains the moment our financial system changed.
Subscribe to receive the guide — form integration removed for this version.
Why Did Silver Pull Back So Sharply From Its January 2026 Peak?
A more-than-250% rise in under a year is rarely sustainable without a correction. The January intraday high reflected intense momentum buying, short covering and speculative positioning that compressed the normal process of price discovery into a short window. Sharp reversals from parabolic peaks are a common feature in silver’s history.
What sets this episode apart is where the market settled after the correction. Previous major rallies erased gains and returned silver to much lower long-term ranges. In contrast, after the January 2026 peak, silver stabilized near $70 — a level that represents a meaningful shift upward from the prior baseline.
Is $70 Silver a Support Level or a Temporary Resting Point?
No price can be guaranteed forever, especially in a volatile market like silver. That said, several signs indicate the $65–$75 area may be more than a temporary rest. First, the rally created buyers across a wide range of entry points; those buyers have incentive to defend their positions. Second, the industrial demand backdrop that helped drive the move remains intact, supported by solar, EVs and electronics. Third, the gold-to-silver ratio has moved toward a more balanced level, reducing the extreme undervaluation signal that existed before the rally. Combined, these elements suggest the current consolidation reflects genuine demand rather than a simple pause.
How Does Silver at $70 Compare to Its Long-Term Trading History?
Historically, silver spent much of the 2013–2024 period trading between roughly $14 and $30. Levels above $25 were often considered elevated. A sustained price near $70 would therefore represent a material regime change if it persists. Precedent exists for such shifts: silver spent the 1990s below $6 and later established a much higher trading baseline following the commodity cycles of the 2000s. Whether the 2025–2026 move represents a comparable long-term repricing will depend on how fundamental demand and macro conditions evolve.
What Would Confirm — or Break — the New Price Floor?
Factors that would confirm a lasting $70 floor include continued growth in industrial demand (notably solar and EV manufacturing), sustained strength in gold prices that keeps the gold-to-silver ratio compressed, and months of consolidation above $65–$70 without a decisive breakdown. Conversely, a prolonged slump in industrial demand, a sharp global monetary tightening, or a risk-off shock forcing broad liquidations could all threaten that support level. Given silver’s volatility, these upside and downside scenarios both merit careful attention.
People Also Ask
What is silver’s new price floor after the 2025–2026 rally?
Following the surge from about $34 to an intraday peak above $120, silver pulled back and consolidated near $70. Whether this becomes a durable floor depends on continued industrial consumption, the gold-to-silver ratio and macroeconomic conditions. As of the March 30, 2026 snapshot, silver remained more than 100% above its price a year earlier.
Why did silver spike above $120 in January 2026?
The spike reflected a convergence of rising industrial demand, a weaker dollar and inflation concerns, an extreme gold-to-silver ratio that signaled relative undervaluation, and the technical completion of a long-term breakout. The final leg of the advance was amplified by speculative buying and short-covering.
Is $70 silver a support level or a temporary pause?
$70 appears to reflect genuine two-sided demand: buyers entered at multiple price points during the rally and industrial consumption remains elevated. Still, silver’s historic volatility means that no level is invulnerable; major shifts in policy or demand could alter the picture.
How does the 2025–2026 silver rally compare to 2011 and 2020?
The 2011 and 2020 rallies were largely sentiment-driven and ultimately fully retraced, returning silver to much lower ranges. The key difference in 2025–2026 is that prices settled substantially above prior baselines after the correction, which is more consistent with a structural repricing than the earlier one-off surges.
This article is for informational purposes only and is not investment advice. Always perform your own research or consult a qualified financial professional before making investment decisions. Past performance does not guarantee future results.
Sources
- GoldSilver.com — Silver spot price chart and historical daily closes, Jan 2020–Mar 2026 (data referenced throughout).
- Silver Institute — World Silver Survey 2025 and related industry reports on fabrication demand and supply trends.
- Exchange-Rates.org — Historical silver price data used for long-term context.
You May Also Like:
- 87% Dollar Devaluation Since 1971: Why Central Banks Keep Buying Gold
- How to Roll Over Your 401(k) Into a Gold IRA
- Why the World Needs More Silver Than It Can Mine
Popular Topics
Picked from the archive
-
01
 Topics
Silver Slides While Gold Holds as Markets Reduce Risk
-
02
Topics
Trump Urges Rate Cuts While Fed Likely Holds Interest Rates
-
03
Topics
China Drives Gold Demand as Goldman Projects $4,000 Target
-
04
Topics
Will Policy Reversal Move Gold? Conflict Pressure Index Insight
-
05
Topics
Why Gold Moves Differently from Stocks and What It Means
-
06
Topics
Trump Imposes 25% Tariff on India’s Oil Imports From Russia
-
07
Topics
After Major Silver Price Crashes: What Investors Can Expect
-
08
Topics
War Risk and Stagflation Signal a 6,300 Gold Price Target