Why Silver Dropped Three Times More Than Gold: The PPI Story
Silver is underperforming gold in today’s session, slipping significantly more on the same economic news. At the 8:30 a.m. ET release of the August Producer Price Index (PPI), silver fell from $67.31 to $64.63 — a decline of about 4.1% — while gold eased roughly 1.35%, trading from $4,401 down to $4,343. That divergence between the two metals is the main takeaway this morning.
This morning gold is trading near $4,343 per ounce, while silver sits around $64.63, down from the pre-release level near $67. Before the PPI print, the gold-silver ratio rested near 66, roughly where it had closed the previous session. Within the hour after the release, the ratio widened to about 67.2 — a quick move for a metric that typically changes by only fractions in a single trading day.
Gold/Silver Ratio — Widening Into Today’s PPI Print
Ratio by session, Sept 8–10, 2026 — GoldSilver price-tracking data
Source: GoldSilver internal price-tracking feed | FXStreet
Why Did Silver Fall Three Times Harder Than Gold Today?
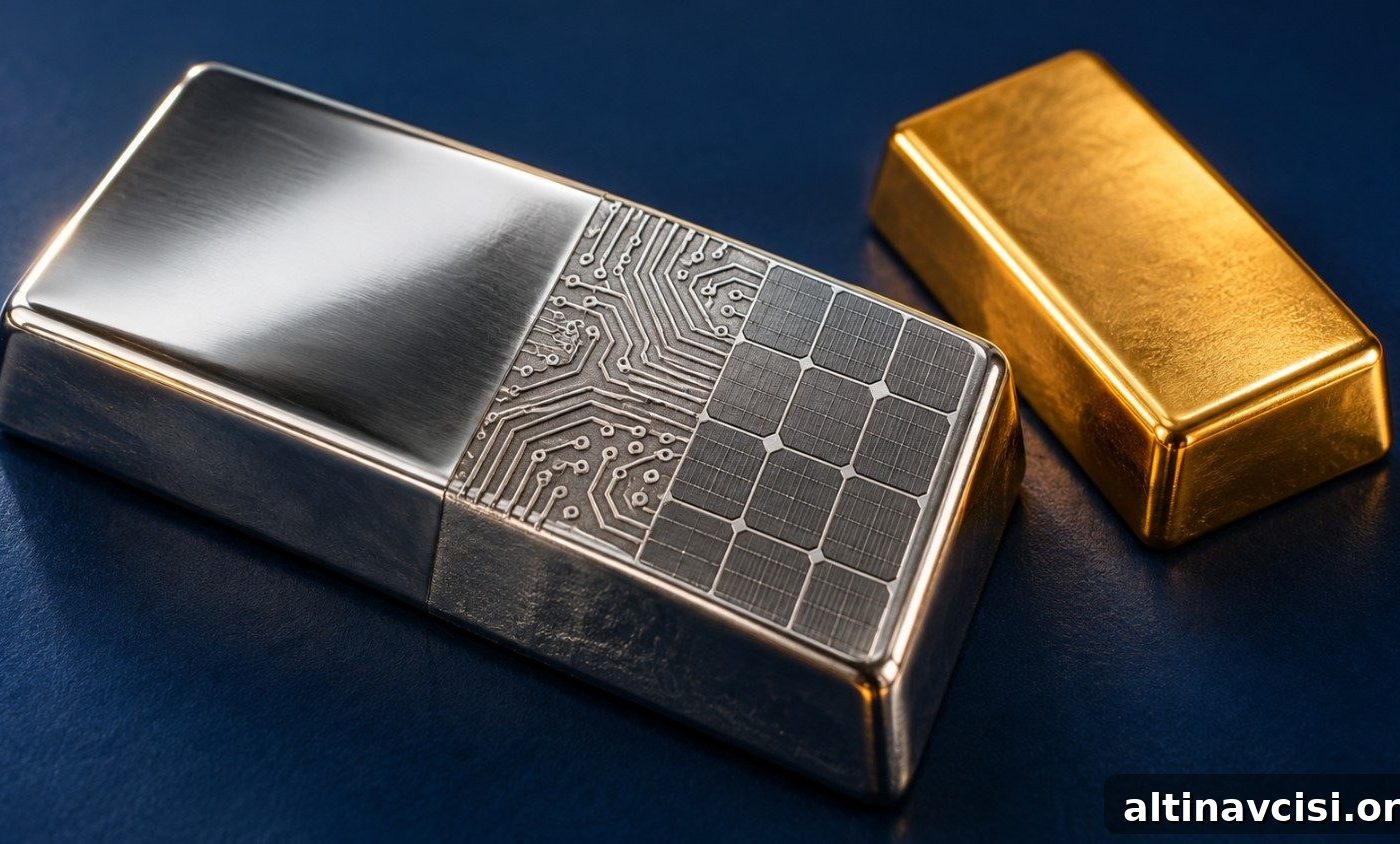
Silver’s heavier fall compared with gold reflects its dual role as both a monetary and an industrial metal. Unlike gold, which is overwhelmingly held as a store of value and an inflation hedge, silver has a large industrial component to demand. According to the World Silver Survey 2026 from the Silver Institute and Metals Focus, roughly 58% of annual silver demand comes from industrial uses — including solar panels, electric vehicles, electronics and semiconductors. That industrial exposure makes silver more sensitive to growth expectations.
When inflation data surprises to the upside, it raises the probability of tighter Federal Reserve policy. Rising Fed rate expectations push up real yields and increase the opportunity cost of holding non-yielding metals. Gold primarily experiences that single channel: repricing due to higher real yields. Silver feels that same pressure and, on top of it, an added markdown tied to the outlook for industrial demand. In short, a hotter inflation signal delivers two overlapping hits for silver but only one for gold — which helps explain the roughly 3-to-1 split in their intraday moves.
Longer-term government bond yields moved higher after the PPI release, with the 10-year Treasury trading near 4.84% — its highest level since November 2023. Higher long-term yields increase the cost of holding non-yielding assets and tend to weigh more heavily on metals with industrial leverage like silver.
What Is the Fed Weighing Before September 16?
The Federal Reserve is evaluating several inputs ahead of its September 15–16 meeting. Today’s PPI data is one of the last major production-side inflation reads before the policy decision, and tomorrow’s Consumer Price Index (CPI) report will provide an additional, closely watched consumer-side datapoint. The Bureau of Labor Statistics reported that headline producer prices rose 0.4% month-over-month in August, with core producer prices up 0.3% — figures that landed on consensus forecasts. What alarmed markets was the year-over-year acceleration: headline PPI increased to 5.4% from 4.8% in July, a move driven in part by a notable monthly jump in energy prices, including a sharp rise in diesel costs. That annual acceleration amplified market reactions beyond the in-line monthly numbers.
Federal Reserve signaling has been split in recent months. At the June meeting, several Fed officials projected at least one rate hike before year-end, while the committee left the funds rate unchanged at 3.50%–3.75% following a vote. With dot-plot projections remaining mixed, the committee will pay close attention to incoming inflation data in deciding its next steps. Today’s PPI and tomorrow’s CPI are therefore important inputs into the Fed’s deliberations.
Why Doesn’t This Sell-Off Break Silver’s Structural Case?
Short-term sell-offs driven by macro surprises do not necessarily alter silver’s structural supply-demand backdrop. The World Silver Survey 2026 documented a multi-year trend of demand outpacing mine supply plus recycling, creating consecutive annual deficits through 2025 and a forecast for continued deficits in 2026. That mechanical supply shortfall is not reversed by a single day’s price action or one inflation report. While traders may reprice risk and leverage quickly, underlying physical constraints — mine production, recycling dynamics and industrial demand — evolve slowly. For holders of physical metal, those structural factors remain distinct from near-term market volatility driven by changing Fed expectations.
What Should Investors Watch Next?
Two near-term events deserve close attention. First, Friday’s CPI report will either reinforce or counter the signal from today’s PPI release. If CPI also accelerates, it will strengthen the case for tighter monetary policy and could keep upward pressure on yields. Second, the Fed’s September 15–16 meeting will provide the committee’s policy decision and updated projections. Investors should monitor whether the gold-silver ratio holds near the widened level around 67.2 or reverts toward recent values near 66 once the CPI data is released. That movement — or lack of reversion — will give a clearer indication of how traders expect the next several weeks to unfold.
Stay On Top of Gold & Silver Prices
Get important market alerts sent straight to your inbox.
SOURCES
1. CME Group & LBMA — Gold and Silver Spot Price Data, September 10, 2026
2. Silver Institute & Metals Focus — World Silver Survey 2026
3. Board of Governors of the Federal Reserve System — FOMC meeting calendars and projections, June 17, 2026
4. U.S. Bureau of Labor Statistics — Producer Price Index news release, August 2026
5. CNBC — U.S. 10-Year Treasury Note yield coverage, September 9–10, 2026
6. TradingKey — US August PPI preview, September 9, 2026
7. FXStreet — Silver price coverage, September 10, 2026
Disclaimer: This article is for informational purposes only and does not constitute investment advice. Past performance is not indicative of future results. Always consult a qualified financial advisor before making investment decisions.
You May Also Like:
- Gold’s Tiny Output Is Worth Twice Aluminum’s. Here Are Four More Signals Like It.
- Fed Hike Odds Went From 54% to 26% to 58%. Now It’s a Coin Flip.
- Gold ETFs Just Pulled In $2 Billion. Silver Investors Pulled Out.
- Gold/Silver Ratio September 2026: What a 12-Week Round Trip Is Telling Holders
- Gold Is Falling Today. Four Other Signals Say the Hard-Assets Trade Isn’t.
- Gold Is Falling for a Reason Most Investors Have Backwards
- Even Central Banks Don’t Trust Someone Else’s Vault Anymore
Popular Topics
Picked from the archive
-
01
 Topics
Federal Reserve Goes Silent: Why Gold Investors Don’t Need It
-
02
Topics
Goldman Cuts Gold Target, JPMorgan Holds: $1,400 Gap Explained
-
03
Topics
PMI Beat Moves Gold Price Two Ways: Markets Priced Only One
-
04
Topics
How to Spot Fake Gold and Silver: Key Tests and Warning Signs
-
05
Topics
Deutsche Bank Identifies Gold Price Floor: Surprise Buyers
-
06
Topics
Gold Pullback Driven by Treasury Buyback, Not ETFs
-
07
Topics
Dollar Devalued 87% Since 1971: Why Central Banks Buy Gold
-
08
Topics
Prediction Market Files to Let Gold Trade 24/7 Forever